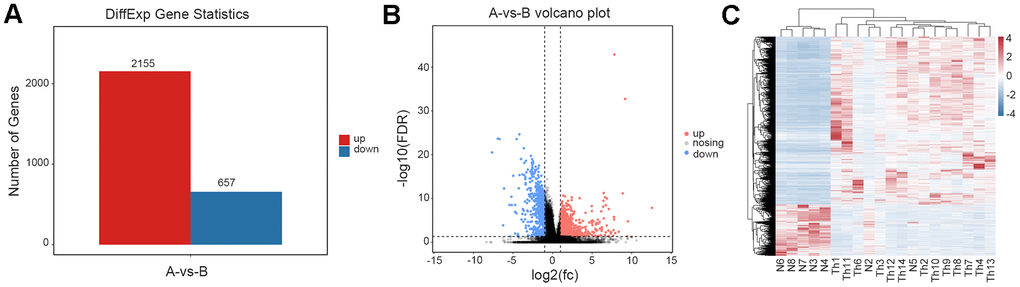
Figure 2.Analysis of differentially expressed genes. (A) The number of differentially expressed genes between normal and thalassemia group. Red represents up expression; Blue represents down expression. (B) The volcano plot shows the differentially expressed genes between normal and thalassemia group. Each dot corresponds to a gene. Red dots represent up expression; Gray dots represent not significant; Blue dots represent down expression. (C) Heatmap of differentially expressed genes in two groups. Red represents high expression; Blue represents low expression.