Submit an Article
Navigate
Home
Editorial Board
Editorial Policies
Current Volume
Archive
Scientific Integrity
Publication Ethics Statements
Interviews with Outstanding Authors
Newsroom
Sponsored Conferences
Podcast
Contact
Special Collections
Submit an Article
Online ISSN: 1945-4589
Research Paper
|
Volume 16, Issue 15
|
pp. 11577–11590
Synergistic insights: the integrated role of CT/CTP and clinical parameters in hemorrhagic transformation prediction
Back to article
Figure 7
(7 of 10)
−
100%
+
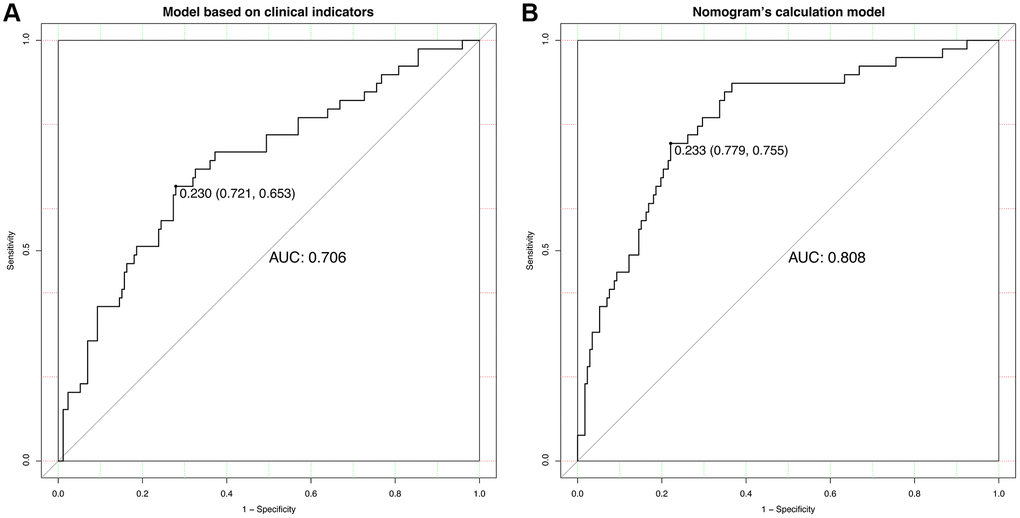
Figure 7.
ROC curve analyses.
(
A
) Analysis of the model based on clinical indicators. (
B
) Analysis based on nomogram’s calculation model.
Figure 7 — Synergistic insights: the integrated role of CT/CTP and clinical parameters in hemorrhagic transformation prediction | Aging