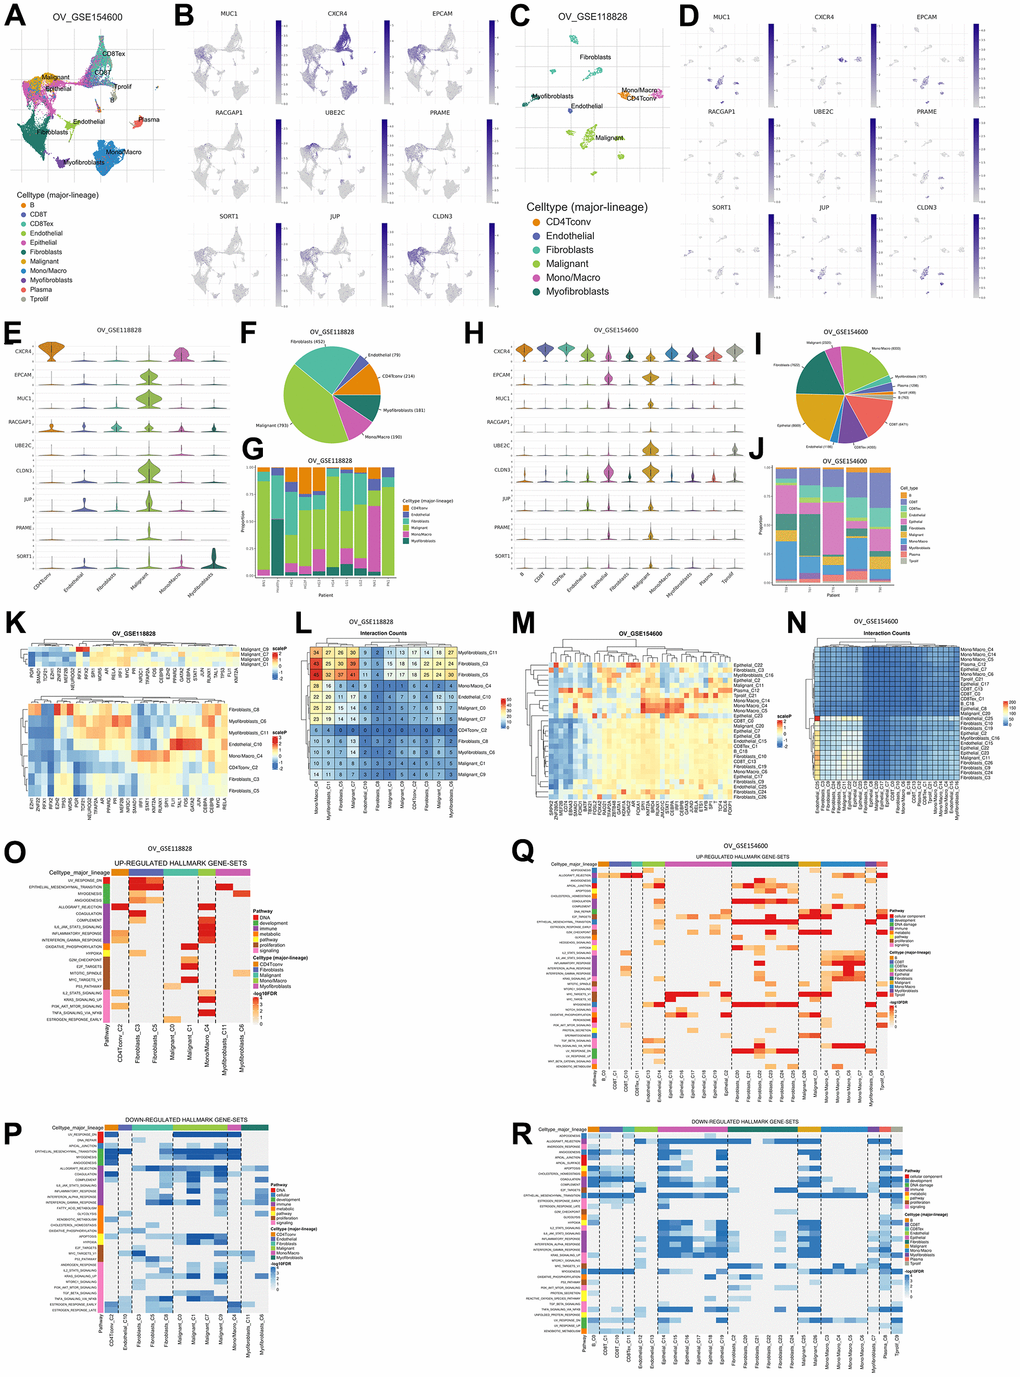
Figure 5.Gene expression levels are based on single-cell RNA sequencing based on a human sample based on the TISCH2 database. (A) Sample from GSE154600 based on 5 non-treatment patients, 42583 cells, analyzed with the 10x genomics platform. (B) UMAP plot of nine TAAr on GSE154600, where EPCAM, MUC1, RACGAP1, CLDN3, and JUP are highly expressed in malignant cell samples. (C) Sample from GSE118828 based on 9 non-treatment patients, 1909 cells, analyzed with the Smart-Seq2 platform. (D) UMAP plot of nine TAAr on GSE118828, where CXCR4, MUC1, EPCAM, UBE2C, CLDN3, JUP, PRAME, and SORT1 are highly expressed in malignant cell samples. (E) Violin diagram of TAAr expression in each sample cell in GSE118828. (F, G) Diversification and comparison of the number of samples analyzed in GSE118828. (H) Violin diagram of TAAr expression in each sample cell on GSE154600. (I, J) Diversification and comparison of the number of samples analyzed on GSE154600. (K) Transcription factor induced by TAAr in GSE118828: the higher the induction, the redder it is. (L) Number of cell-cell interactions in sample GSE118828. (M) Transcription factor induced by TAAr in GSE154600: the higher the induction, the redder it is. (N) Number of cell-cell interactions in the GSE154600 sample. (O, P) The genetical hallmarks that are up-downregulated based on the TAAr gene in GSE118828. (Q, R) The genetical hallmarks that are up-downregulated based on the TAAr gene in GSE154600.