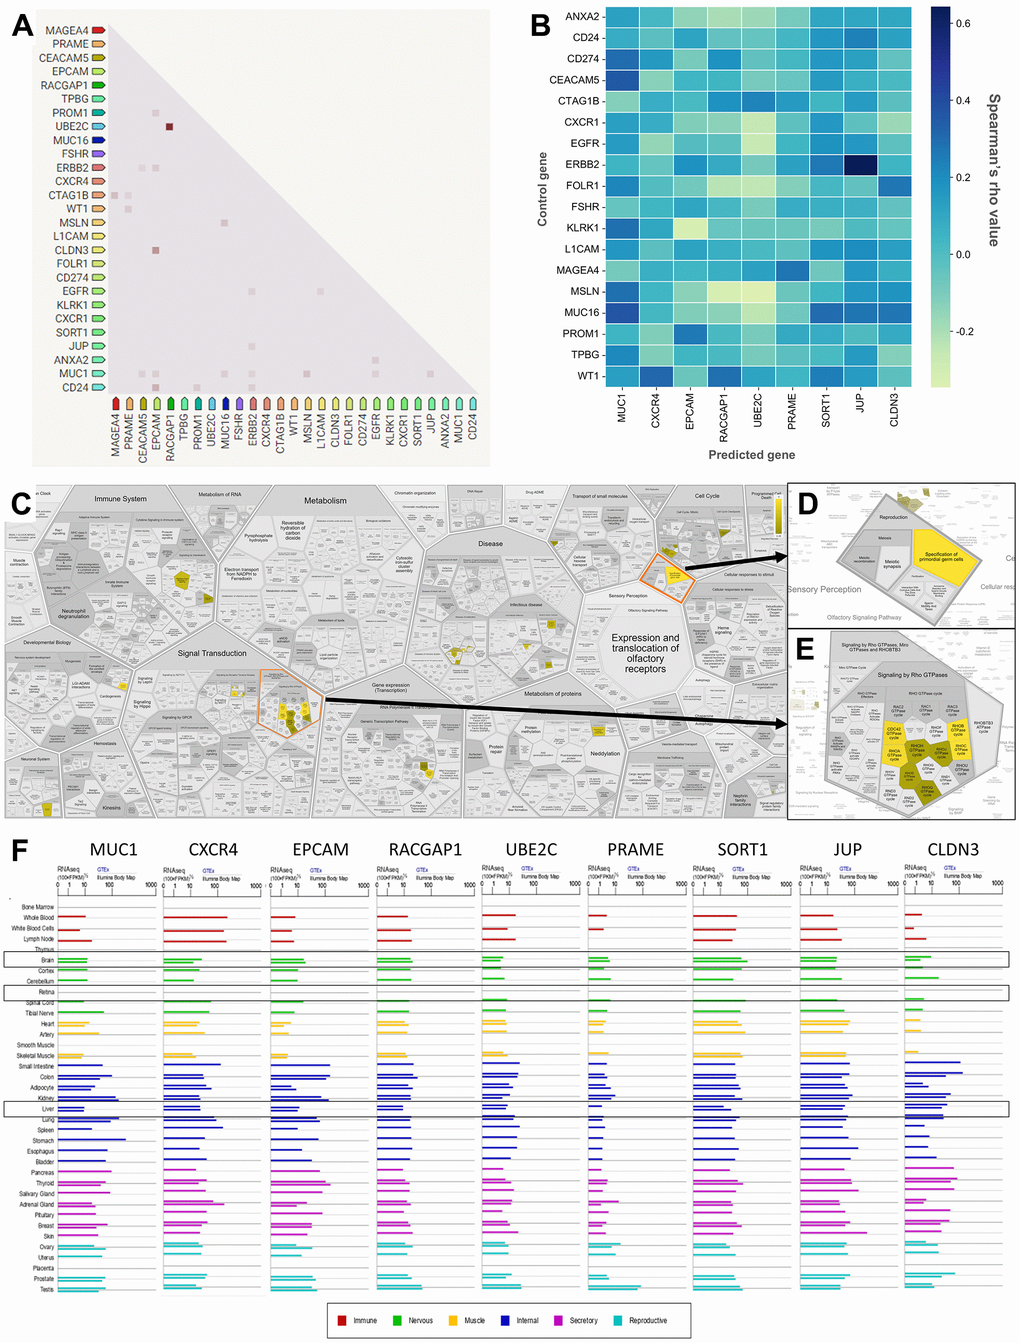
Figure 4.Correlation, co-expression, and pathway analysis of TAAr. (A) Co-expressed genes are colored by a dot; a darker dot means a higher co-expression score. Co-expression score: the higher the score, the higher the probability that co-expression will occur. (B) Spearman’s correlation scores for gene expressions in ovarian cancer (OC), which are comprised of 27 proteins consisting of nine TAAr and 18 control genes. (C) The complete pathway of the Reactome database related to TAAr. This pathway was constructed with the Voronoi tessellation method termed ReacFoam, which provides user-friendly access and visualization. (D) Pathway related to reproduction where the specification of primordial germ cells pathway is located. (E) Rho GTPase-related and neighbor pathways. (F) The expression data of TAAr in brain, retina, and liver tissue, provided by GeneCard, were used to analyze the possible toxic effects of targeting TAAr.