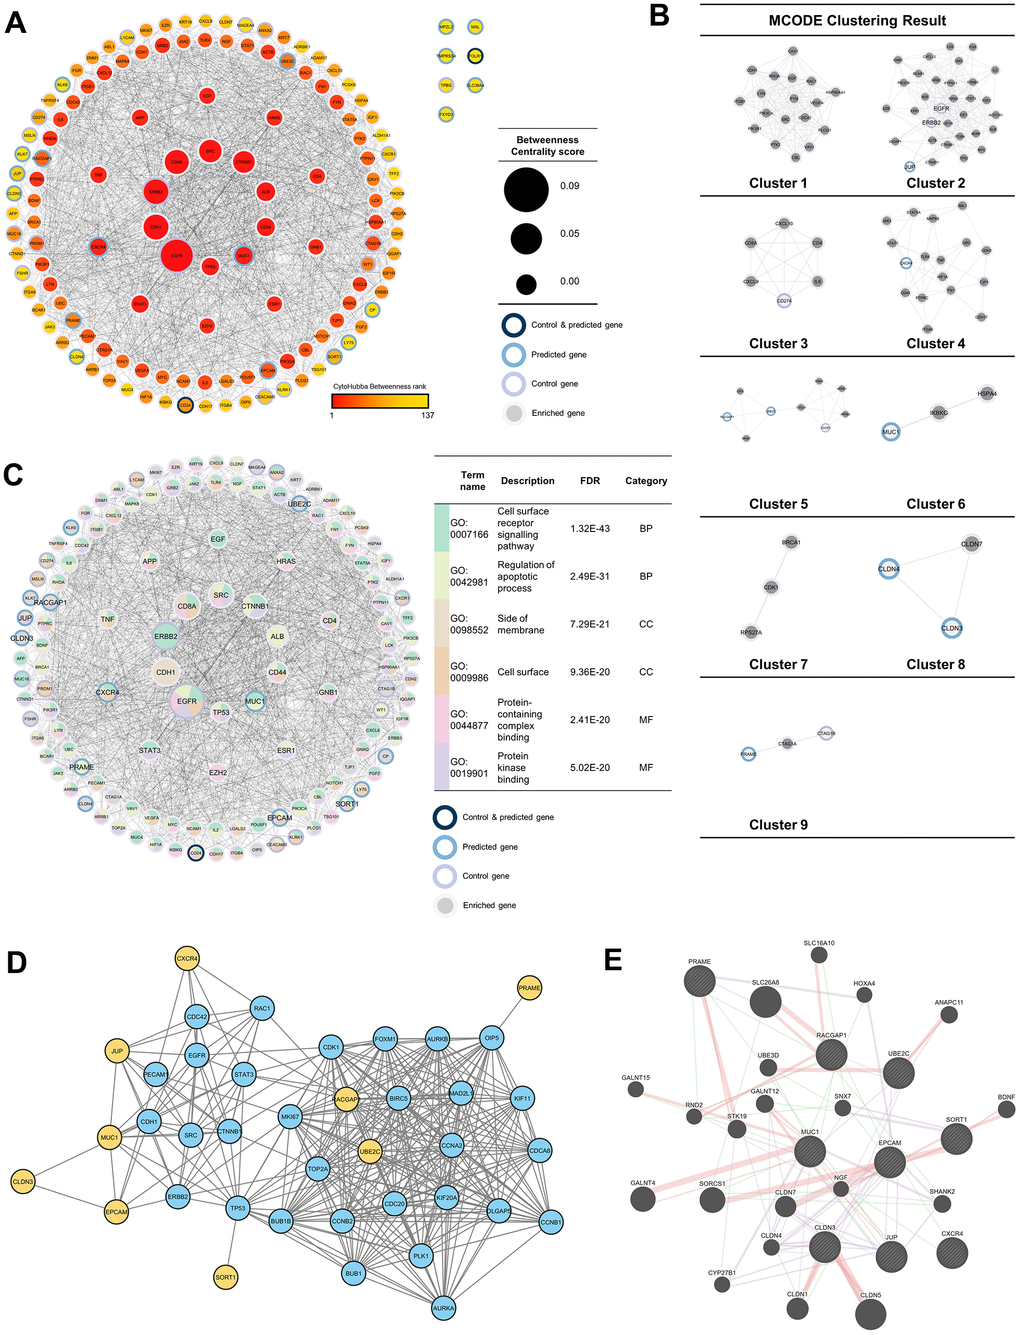
Figure 3.Protein-protein interaction (PPI) network analysis. (A) PPI network of 37 enriched genes (20 control and 17 predicted genes) with 100 genes, which were analyzed with NetworkAnalyzer and CytoHubba for node and edge scoring. Nine genes with the highest betweenness-centrality scores were designated as TAAr. (B) Clustered network with the Molecular Complex Detection (MCODE) algorithm. (C) Gene ontology (GO) terms related to control and predicted genes. (C) GO term related to control and predicted genes. (D) Interaction network of the TAAr gene: yellow genes are TAAr, and blue genes are interactor proteins. (STRING database, high confidence: 0.7). (E) GeneMania network of TAAr. The nine biggest nodes with shading are TAAr genes. Edge width is labeled for confidence scores.