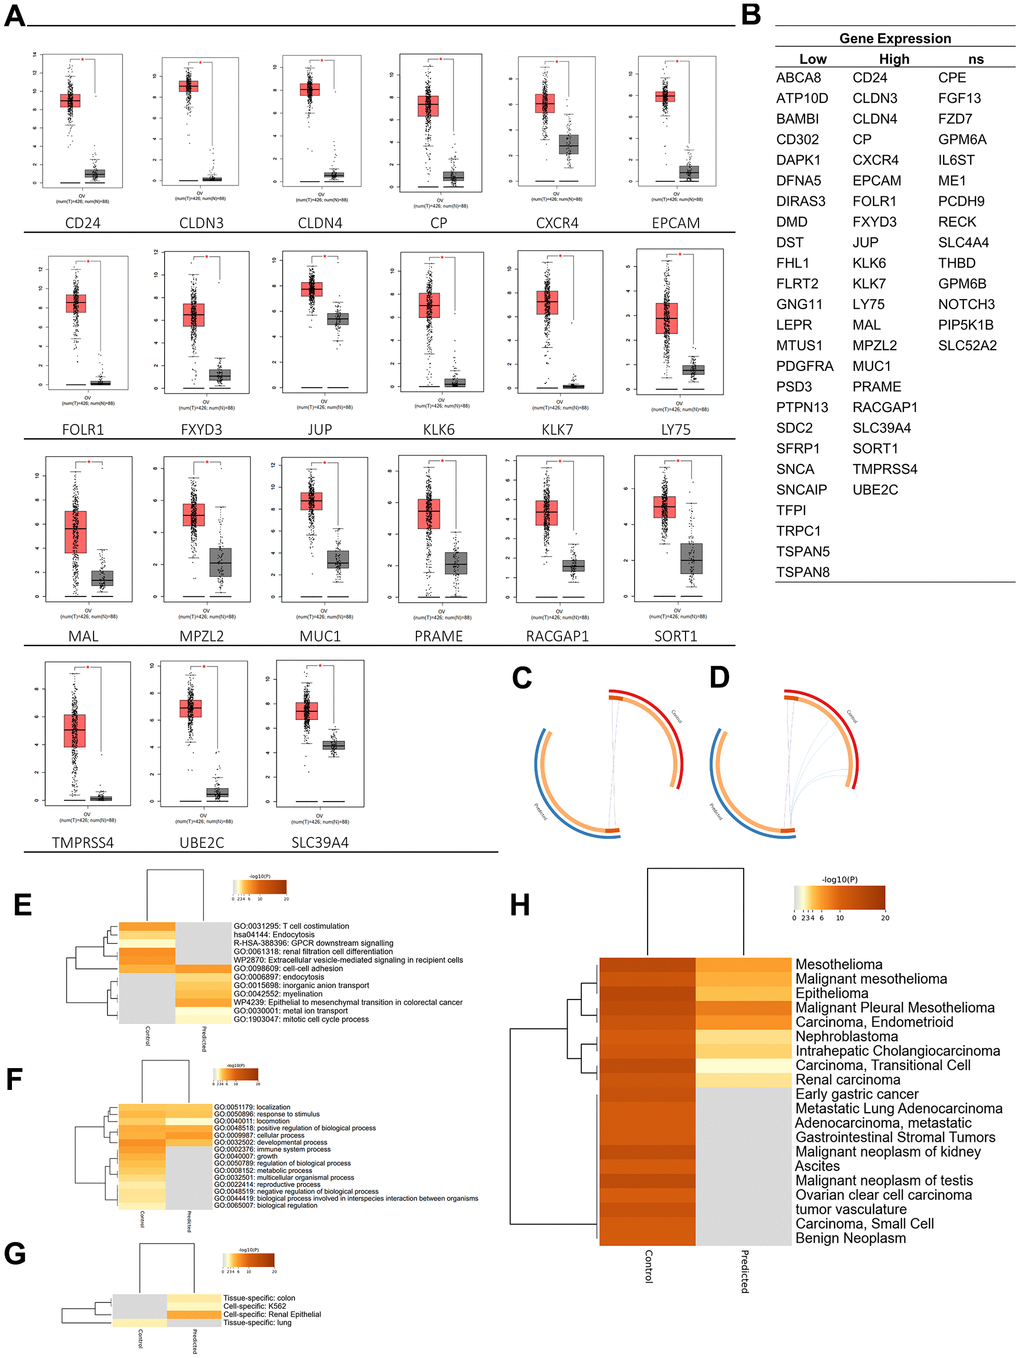
Figure 2.Oncogenicity analysis. (A) Twenty-one genes were significantly expressed in ovarian cancer among plasma membrane-related genes. (B) Plasma membrane-related genes expressions in ovarian cancer. (C) Overlap between gene lists: high expression gene list (Predicted) and Control gene list, (D) including the shared term level, where blue curves connect genes that share an enriched ontology term. Gene lists are represented by the inner circle, with hits arranged along the arc. Genes that appear on multiple lists are depicted in dark orange, while genes that only appear on one list are displayed in light orange. (E) Heatmap of enriched terms across input gene lists, colored by p-values. (F) Heatmap of biological processes across input gene lists, colored by p-values. (G) Pattern genes related to predicted and control genes. (H) DisGeNET is a discovery platform containing one of the largest publicly available collections of genes and variants associated with human diseases. The heatmap is colored by p-values. Dark orange indicates a greater probability that bioactivity will occur.