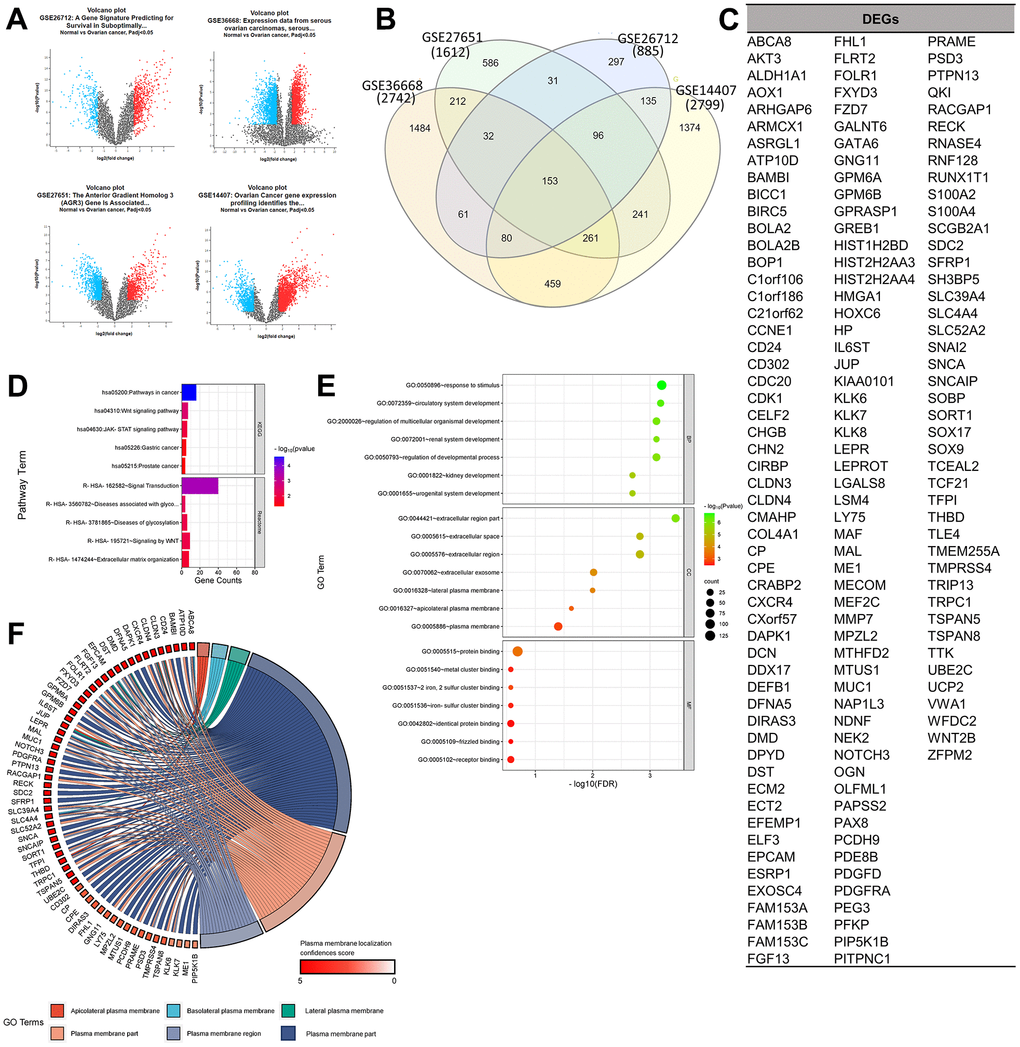
Figure 1.Determination of gene set enrichments (GSEs) and differentially expressed genes (DEGs). (A) Volcano plot of gene distributions in control and ovarian cancer samples. Gray dots represent genes that are not significantly expressed between normal and ovarian cancer cell samples. (B) Venn diagram of overlapping gene between four GSEs from which we obtained 153 DEGs. Also, the highest unique genes are GSE36668, GSE14407, and GSE27651. (C) List of DEGs. (D) Pathway terms related to DEGs, colored by –log10(p-values). (E) Gene ontology terms related to DEGs, colored by –log10 (p-values). (F) Plasma membrane-related genes from six GO terms (p > 0.05) with localization confidence scores. A higher score means a greater probability that the protein will be situated there.