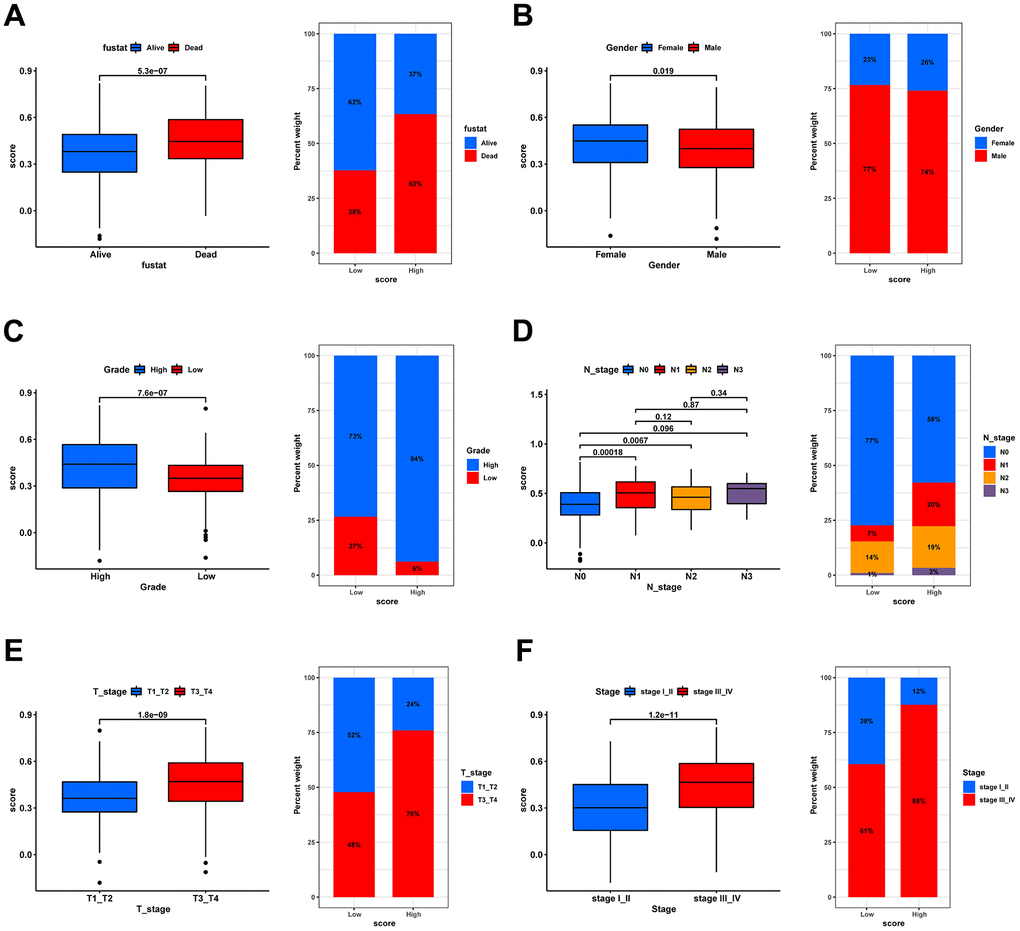
Figure 9.Correlation analysis of risk scores with clinical characteristics. Box plot for differences in risk score distribution (left) and bar plot for sample distribution in high- and low-risk groups (right) in different survival status (A), gender (B), grade (C), N stage (D), T stage (E), and tumor stage (F).