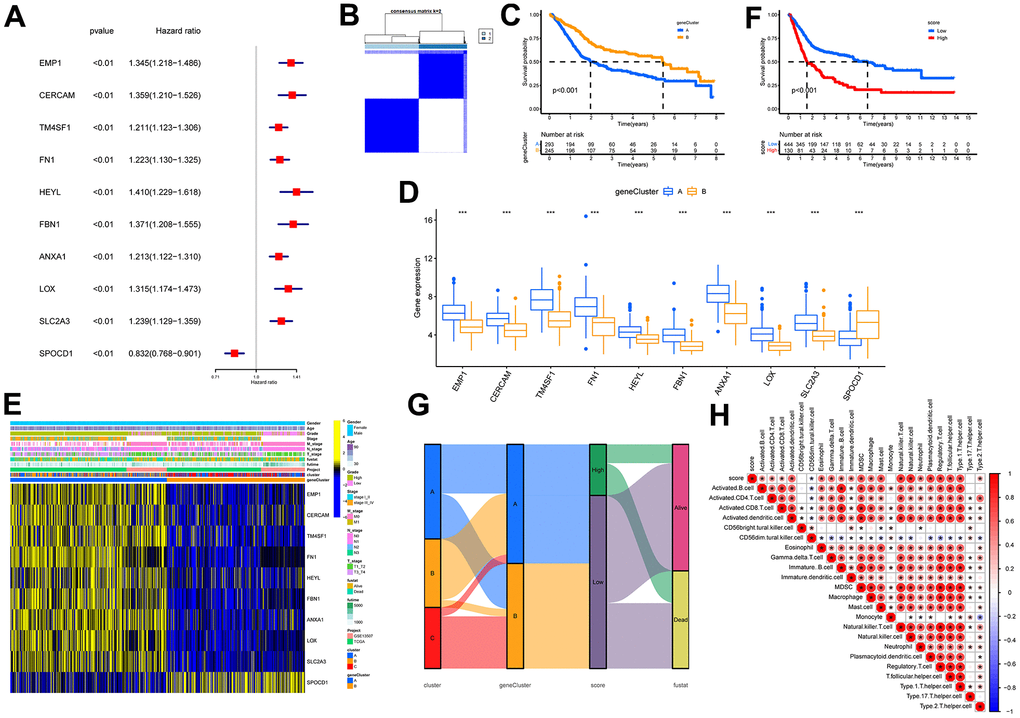
Figure 8.Identification of molecular subtypes and prognostic signature. (A) Forest plots for the univariate regression analysis of the 10 signature genes. (B) Consensus matrix plots based on signature genes. K = 2 was determined as the optimal clustering number. (C) Kaplan-Meier survival analysis in molecular subtypes A and B. Patients in subtypes A were related to a poorer prognosis than those in subtypes B. (D) Differential expression of signature genes in molecular subtypes. *** indicates p<0.001. (E) Heatmap of the signature gene expressions among molecular subtypes A and B. (F) Kaplan-Meier survival analysis between high- and low-score groups. Patients in high-score groups were related to a poorer prognosis compared to those in low-score groups. (G) Sankey diagram showing the dynamics of individual clusters concerning survival status. (H) Heat map of the correlation between prognostic signature score and immune cell infiltration. Red represents a positive correlation, blue represents a negative correlation; * indicates p<0.05.