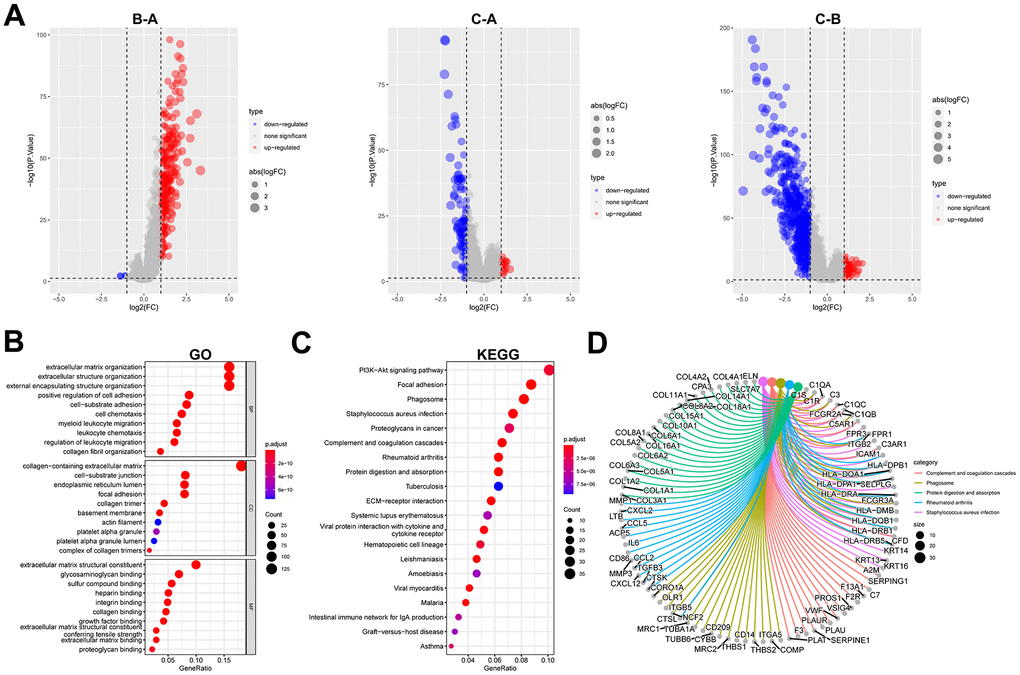
Figure 7.Identification and functional enrichment analysis of DEGs between fibroblast marker gene subtypes. (A) Volcano plots of differential expression of genes among clusters A, B, and C. The red dots represent upregulated genes and the blue dots represent downregulated genes. (B) Bubble plots of the GO terms of differential expression of genes. (C) Bubble plots of the KEGG pathways of differential expression of genes. (D) Correspondence between top 5 pathway and genes in KEGG.