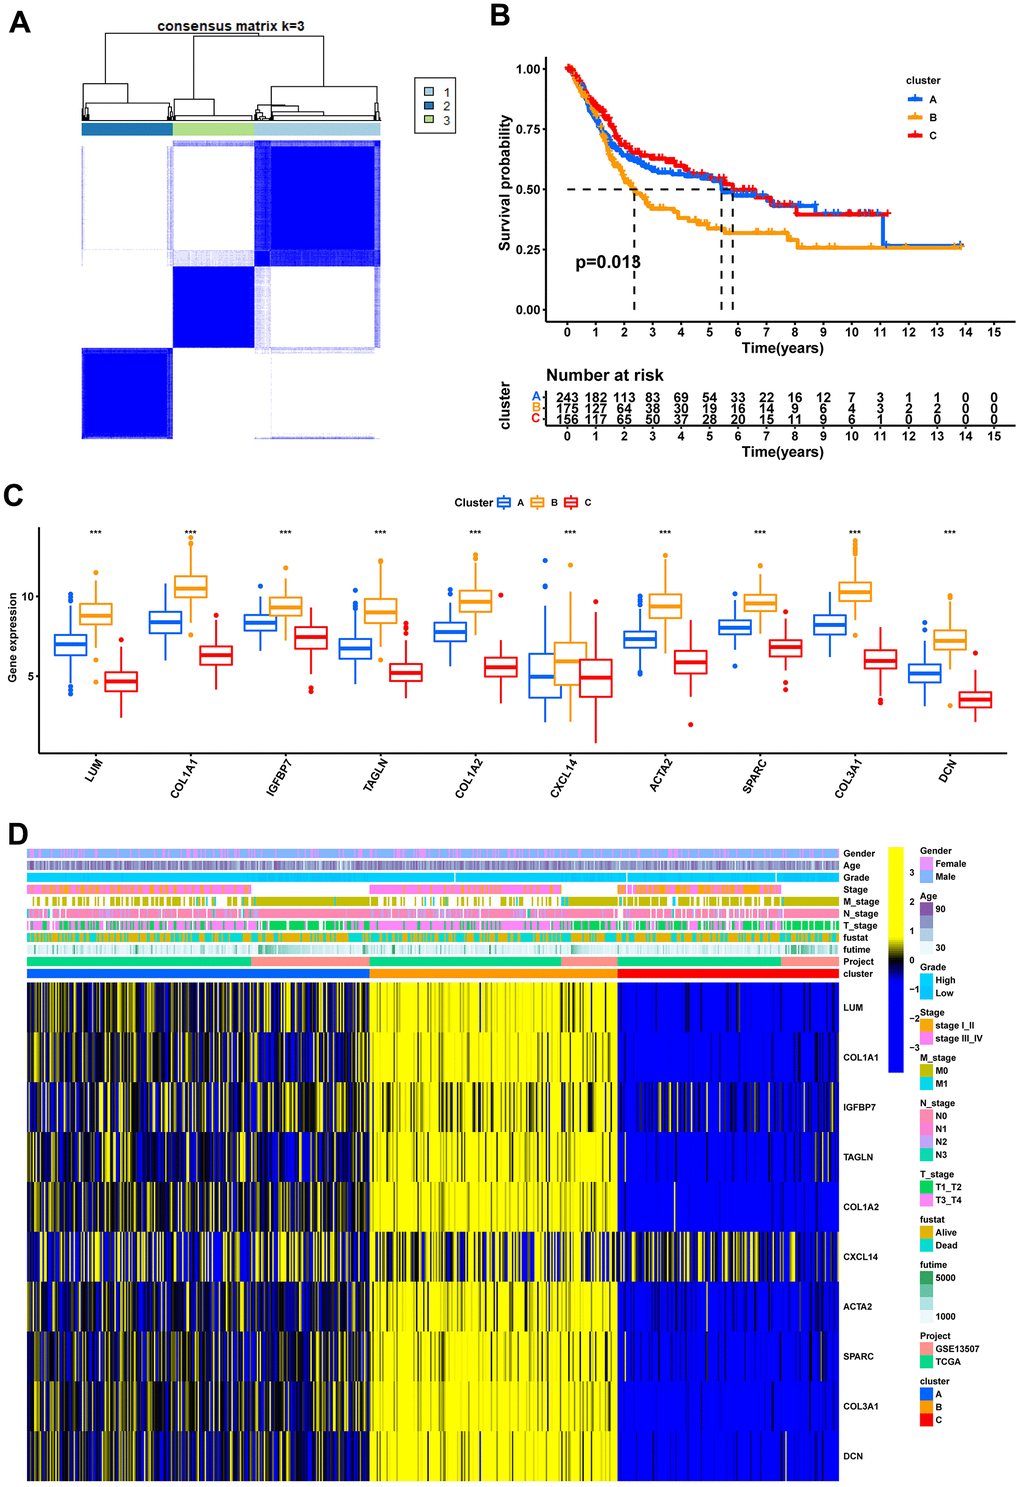
Figure 4.Recognition of 3 fibroblast marker gene subtypes by consensus clustering analysis. (A) Consensus matrix plots. K = 3 was determined as the optimal clustering number. (B) Kaplan-Meier survival analysis in clusters A, B, and C. (C) Differential expression of marker genes in fibroblast marker gene subtypes. (D) Heatmap of the marker gene expressions among clusters A, B, and C.