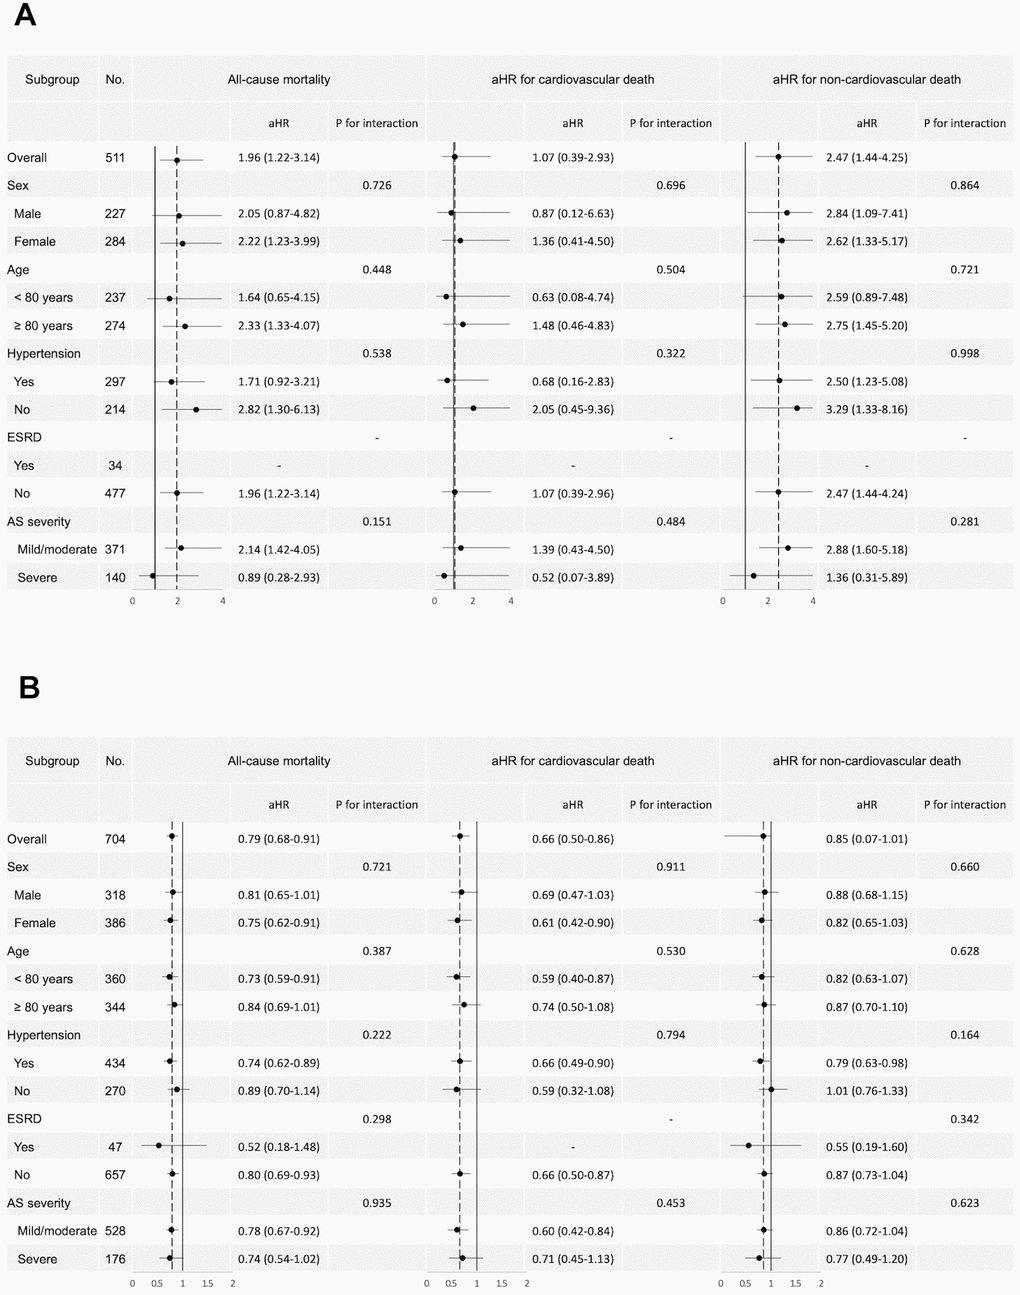
Figure 2.Forest plot of subgroup analysis. Forest plot of subgroup analysis for all-cause mortality, cardiovascular death, and non-cardiovascular death. (A) Subgroup analysis comparing underweight and normal BMI patients. (B) Subgroup analysis comparing obese and normal BMI patients. The plots display the adjusted hazard ratios (aHR) and 95% confidence intervals (CI) for various subgroups within the study population, including the p-values for interaction. BMI, body mass index; AS, aortic stenosis; ESRD, end stage renal disease.