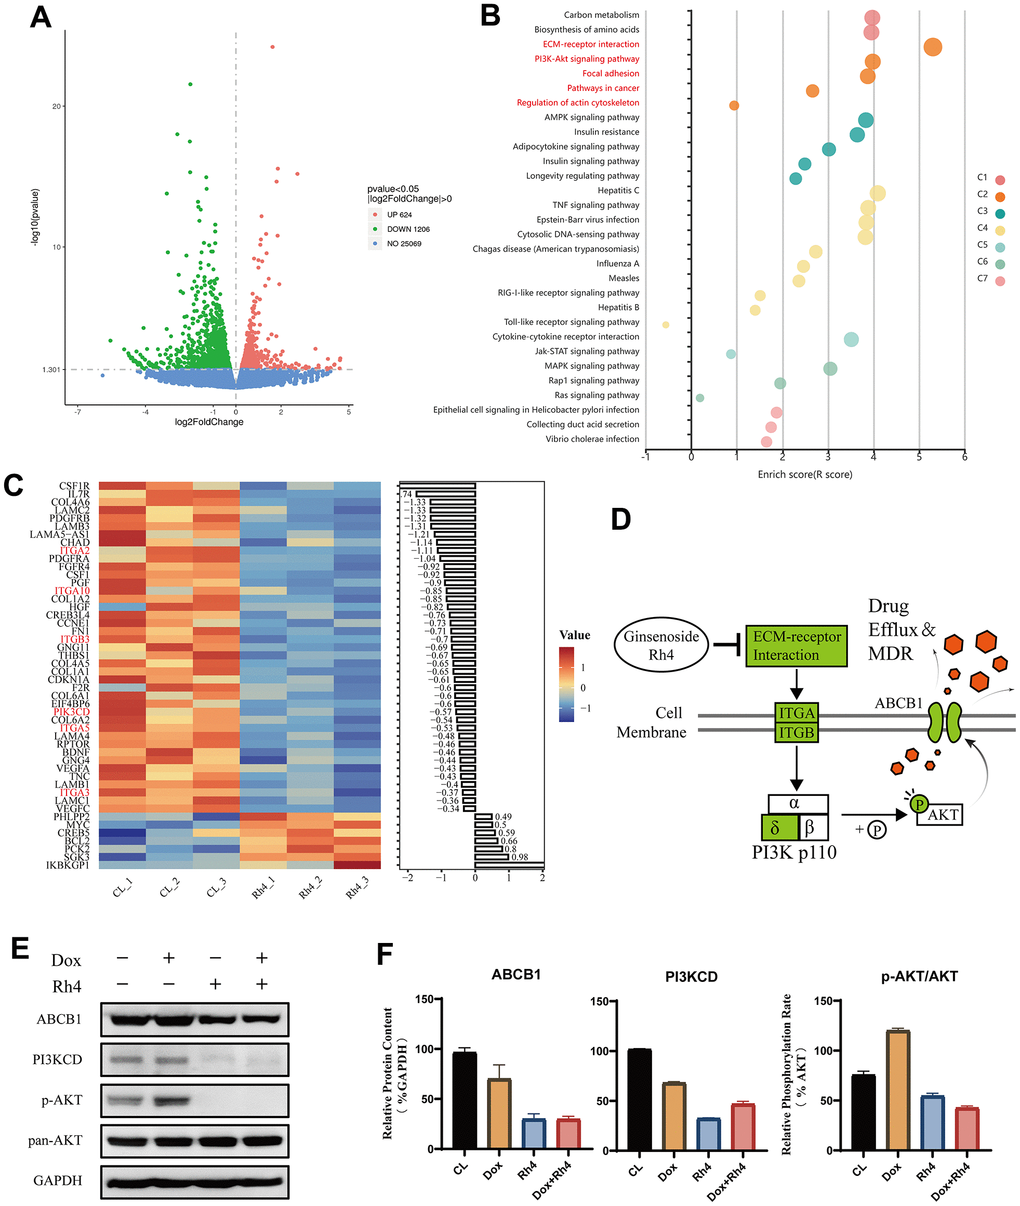
Figure 6.Differential gene expression and pathway analysis influenced by ginsenoside Rh4. (A) Volcano plot visualization of differentially expressed genes (DEGs) between the control (CL) and Rh4-treated groups, highlighting significant gene expression changes. (B) Enrichment results of KEGG pathways for DEGs between CL and Rh4 groups, depicted in various colors to represent different clusters as identified by the KOBAS-i model. (C) Heatmap representation of the regulation of PI3K/AKT pathway-related genes among DEGs between CL and Rh4 groups, illustrating the detailed gene expression modulation within this pathway. (D) Schematic representation of Ginsenoside Rh4’s modulation of ABCB1 expression via the PI3K/AKT pathway, where green denotes suppression of related gene expression. (E) Western blot analysis of ABCB1 and PI3K/AKT pathway-related protein levels, using GAPDH as an internal control. A bar graph shows the relative protein expression levels across the study groups, indicating the impact of Rh4 on these key regulatory proteins.