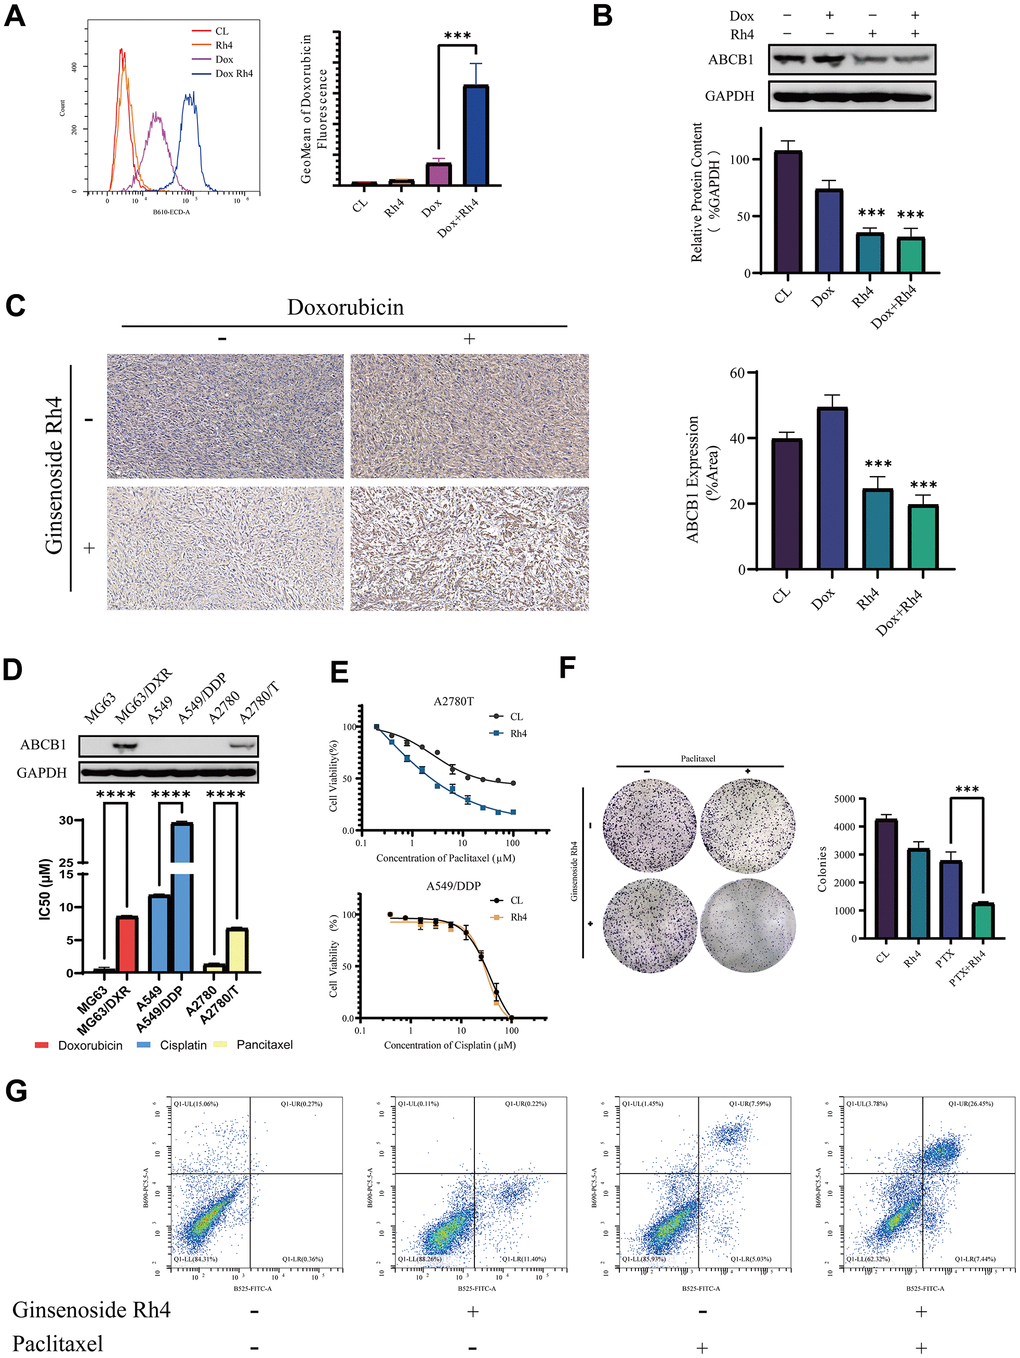
Figure 5.Molecular mechanisms underlying the reversal of drug resistance in MG63/DXR by ginsenoside Rh4. (A) An intracellular accumulation of doxorubicin in MG63/DXR cells was measured by flow cytometry, with autofluorescence intensity in the B610-ECD-A channel. The x-axis represents the fluorescence intensity, while the y-axis denotes cell count. The further right the peak of fluorescence intensity for each group, the greater the intracellular retention of doxorubicin in that group. The accompanying bar graph uses the GeoMean of fluorescence intensity to represent the amount of doxorubicin uptake for each group. (B) The expression levels of ABCB1 protein analyzed through Western blotting, employing GAPDH as an internal control. A bar graph illustrates the relative protein expression levels among the study groups. (C) Immunohistochemistry (IHC) employed to assess ABCB1 expression in vivo, with accompanying bar graphs depicting protein expression levels within each experimental group. (D) Comparative ABCB1 expression in drug-resistant versus sensitive cell lines analyzed by Western blot, including a bar graph detailing IC50 values for various cell lines and drugs, elucidating the role of ABCB1 in drug resistance. (E) Dose-response curves highlighting the sensitivities of A2780T cells to paclitaxel and A549/DDP cells to cisplatin, with and without Rh4 treatment, detailing shifts in IC50 values that signify modulation of drug sensitivity by Rh4. (F) Colony formation assays in A2780T cells exploring the synergistic effects of paclitaxel (2 μM) and Rh4 (40 μM) on cell proliferation and survival. (G) Apoptosis in A2780T cells treated with and without ginsenoside Rh4 (40 μM) and paclitaxel (2 μM) for 24 hours was analyzed using flow cytometry with Annexin V-FITC/PI staining to distinguish apoptotic cells from viable cells, highlighting the pro-apoptotic effect of Rh4 in the context of chemotherapy. In the flow cytometry plots, the y-axis represents PI staining fluorescence intensity, and the x-axis represents Annexin V-FITC fluorescence intensity. Each plot is divided into four quadrants: LL (low signal on both axes), LR (high signal on the x-axis and low on the y-axis), UL (low signal on the x-axis and high on the y-axis), and UR (high signal on both axes). These quadrants correspond to different cell states: LL for viable cells, LR for early apoptotic cells, UL for necrotic cells, and UR for late apoptotic cells. The results show a significant increase in the proportion of late apoptotic cells in the Rh4 and paclitaxel co-treatment group.