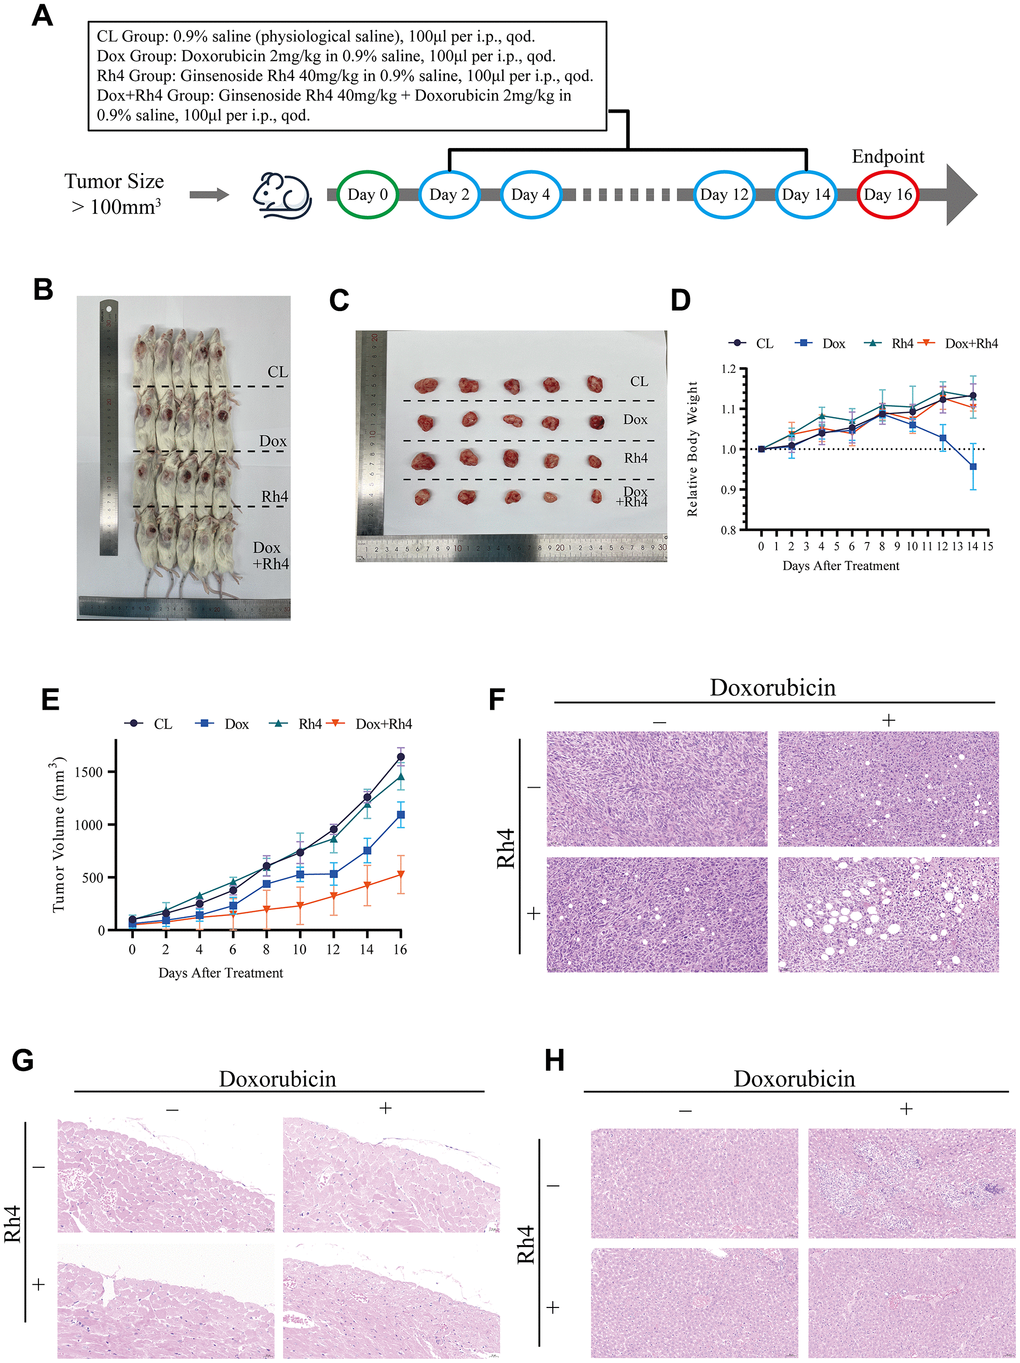
Figure 4.Therapeutic efficacy of doxorubicin combined with ginsenoside Rh4 in vivo. (A) Schematic representation of the treatment schedule for NCG mice, detailing drug administration intervals and evaluation time points. (B) Images of excised tumors at study conclusion, illustrating variance in tumor size among treatment groups. (C) Comparison of resected tumor sizes against a ruler, underscoring the impact of treatment modalities on tumor growth. (D) Line graph depicting the relative body weight changes across treatment groups, noting the absence of significant weight loss in the combination therapy group compared to the doxorubicin group. (E) Tumor volume progression curves for each treatment group, indicating a decelerated growth rate in the combination therapy cohort. (F) Histological analysis of tumor tissue sections stained with H&E, showing pronounced apoptotic and necrotic alterations in the combination therapy group. (G) H&E-stained heart tissue sections, affirming the absence of detrimental effects attributable to ginsenoside Rh4 or the combination therapy. (H) H&E-stained liver tissue sections, revealing no exacerbation of side effects due to ginsenoside Rh4 or the combined treatment.