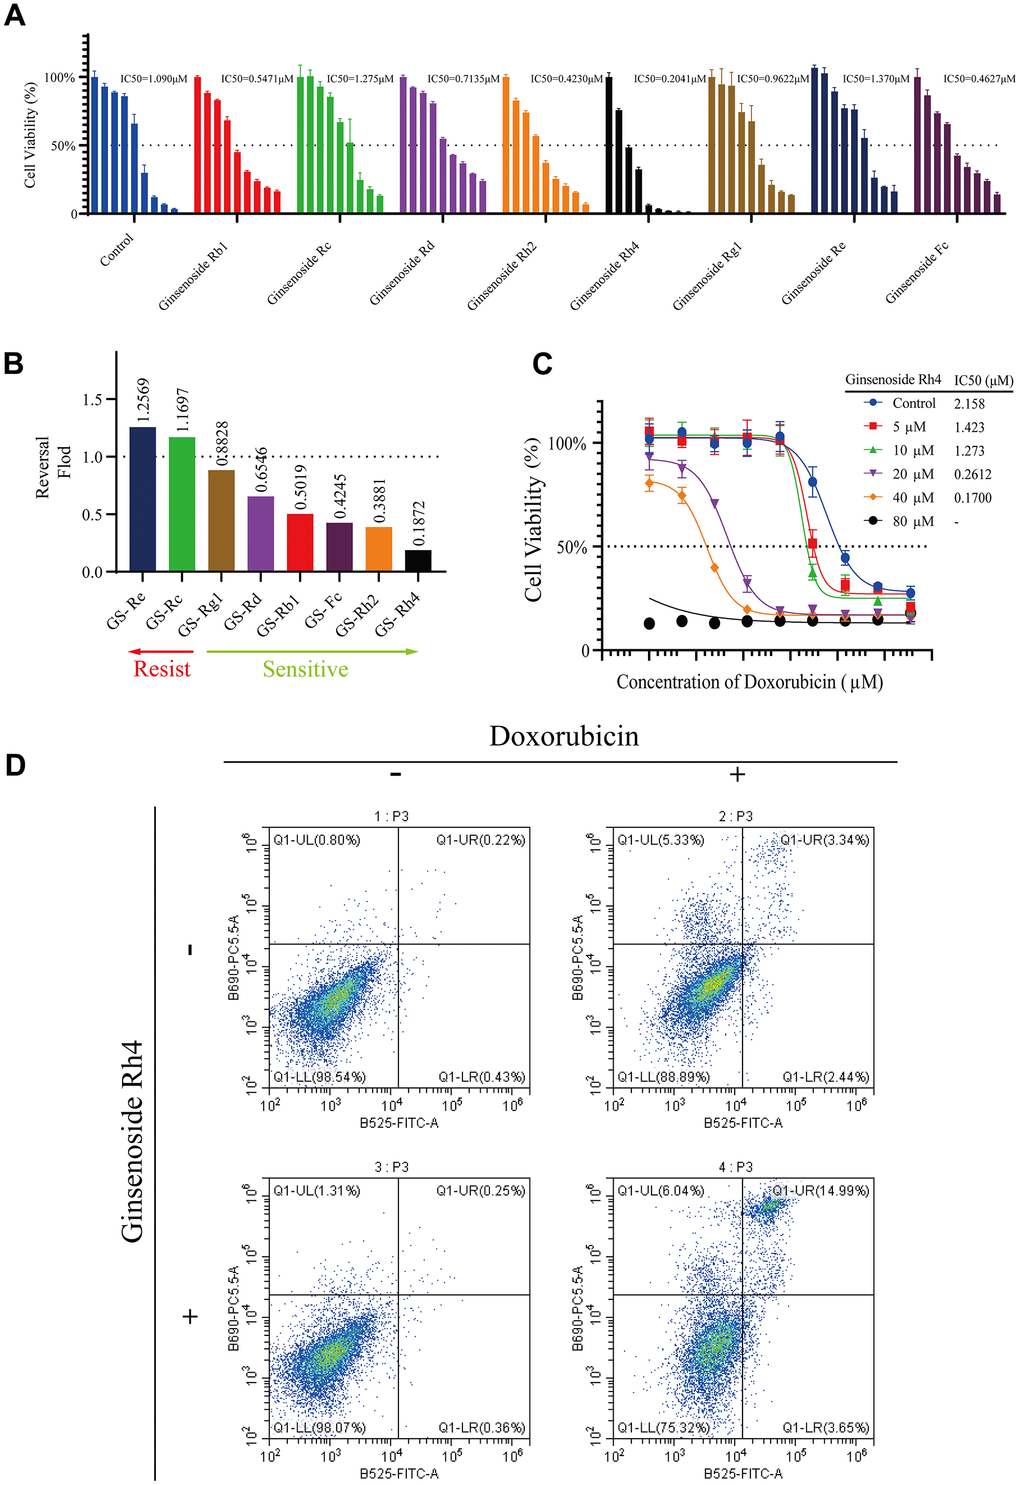
Figure 2.Modulation of doxorubicin sensitivity in MG63/DXR cells by ginsenosides. (A) The CCK-8 assay demonstrates a comparative analysis of eight ginsenosides (40 μM) in reversing doxorubicin resistance in MG63/DXR cells over 48 hours, showing the dose-response and corresponding IC50 values for each ginsenoside (40 μM). (B) The bar graph illustrates the fold change in doxorubicin sensitivity (IC50 with ginsenoside treatment/IC50 of control) in MG63/DXR cells post-treatment with the eight ginsenosides, with Rh4 exhibiting the lowest fold change, indicating the strongest reversal of resistance among the tested compounds. (C) Dose-response curves for MG63/DXR cells treated with incremental concentrations of ginsenoside Rh4 (0-80 μM) in combination with doxorubicin over 48 hours, demonstrating enhanced chemosensitivity. (D) Flow cytometry analysis of apoptosis in MG63/DXR cells treated with ginsenoside Rh4 (40 μM) and doxorubicin (0.6 μM) for 24 hours using Annexin V-FITC/PI staining. The vertical axis represents PI staining fluorescence intensity (y-axis), and the horizontal axis represents Annexin V-FITC fluorescence intensity (x-axis). Each flow cytometry plot is divided into four quadrants: LL (low signal on both axes), LR (high signal on the x-axis and low on the y-axis), UL (low signal on the x-axis and high on the y-axis), and UR (high signal on both axes). These quadrants indicate different cell states: LL for viable cells, LR for early apoptotic cells, UL for necrotic cells, and UR for late apoptotic cells. The results show a significant increase in the proportion of late apoptotic cells in the Rh4 and doxorubicin co-treatment group.