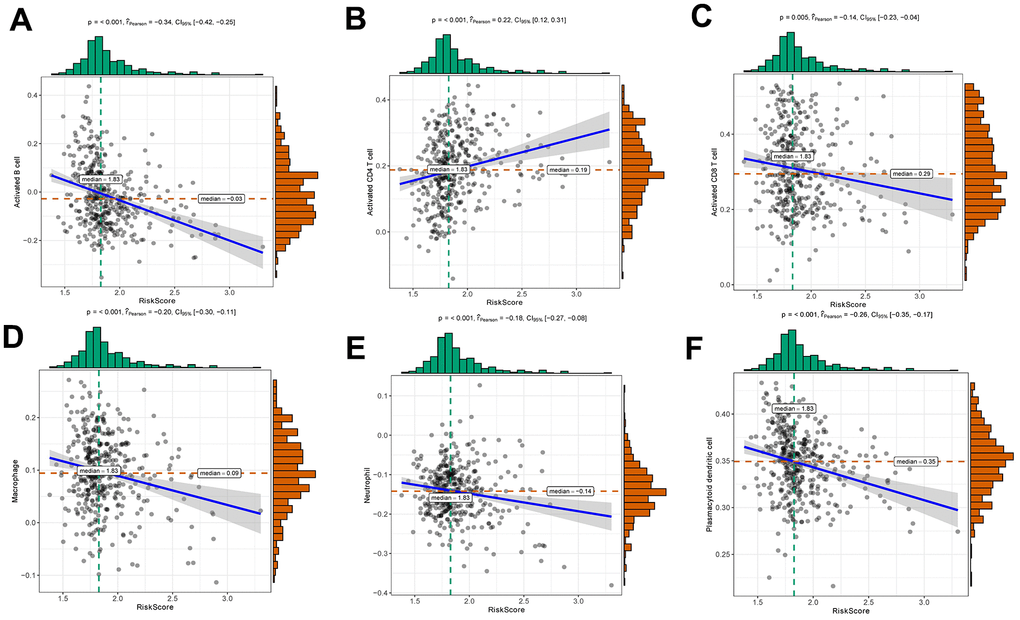
Figure 6.Relationships between risk score and activated B cell (A), activated CD4 T cell (B), activated CD8 T cell (C), macrophage (D), neutrophil (E) and plasmacytoid dendritic cell (F).
Figure 6 — Consensus clustering and novel risk score model construction based on m6A methylation regulators to evaluate the prognosis and tumor immune microenvironment of early-stage lung adenocarcinoma | Aging