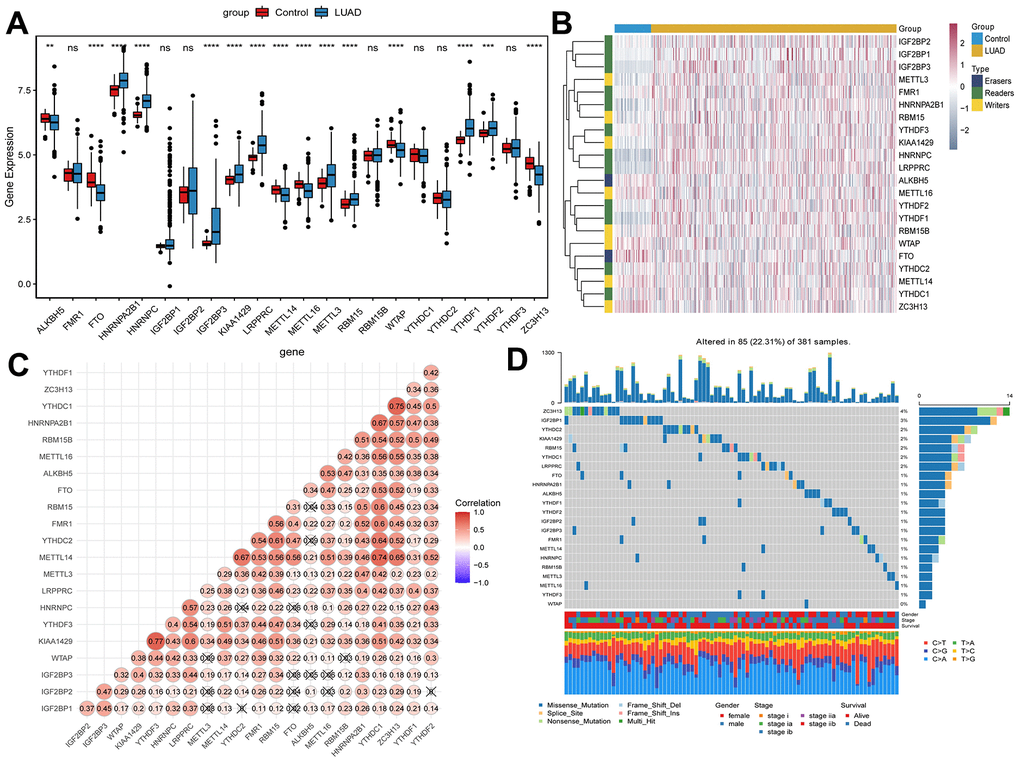
Figure 1.Expression of m6A methylation regulators in early-stage LUAD. (A) Expression boxplot of m6A methylation regulators in early-stage LUAD tissues and normal control tissues. *, P < 0.05; **, P < 0.01; ***, P < 0.001; ****, P < 0.0001. (B) Heatmap of m6A methylation regulators expression in early-stage LUAD tissues and normal control tissues. Complete-linkage method combined with Euclidean distance was used to construct clustering. (C) Correlation between m6A methylation regulators. Red and blue represent positive and negative correlation, respectively. (D) Mutation frequency of m6A methylation regulators in early-stage LUAD. The numbers and barplot on the right represent the mutation frequency of each m6A RNA methylation regulator and the proportion of each variant type, respectively.