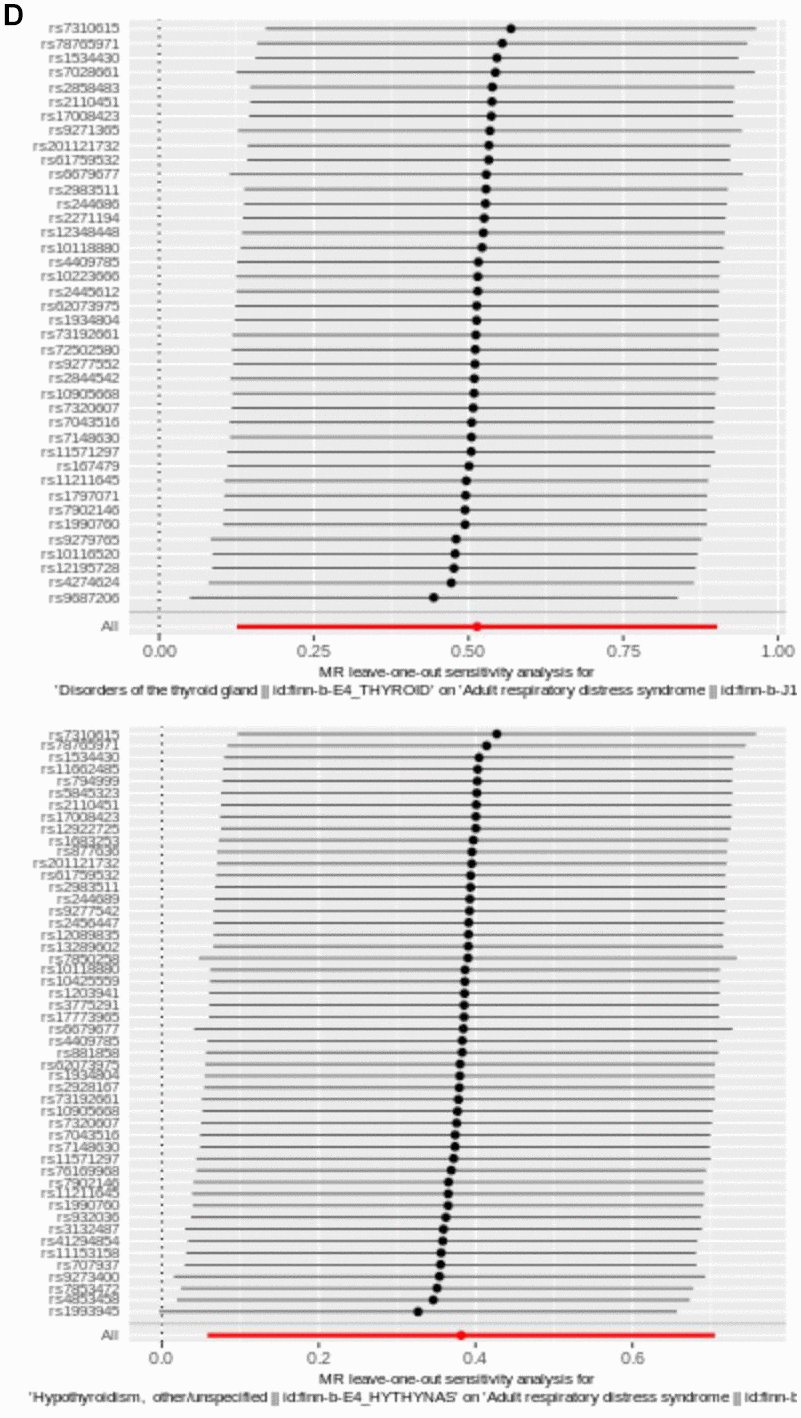
Figure 2.(D) Plot of LOO. Each row was considered an independent MR analysis to estimate causal effect using all of remaining IVs except for single SNP listed on y-axis. Additionally, all data points were required to be greater than zero on the x-axis.