Submit an Article
Navigate
Home
Editorial Board
Editorial Policies
Current Volume
Archive
Scientific Integrity
Publication Ethics Statements
Interviews with Outstanding Authors
Newsroom
Sponsored Conferences
Podcast
Contact
Special Collections
Submit an Article
Online ISSN: 1945-4589
Research Paper
|
Volume 16, Issue 17
|
pp. 12209–12224
Genetic effect of thyroid function-related diseases on acute respiratory distress syndrome: a Mendelian randomization study
Back to article
Figure 2
(4 of 8)
−
100%
+
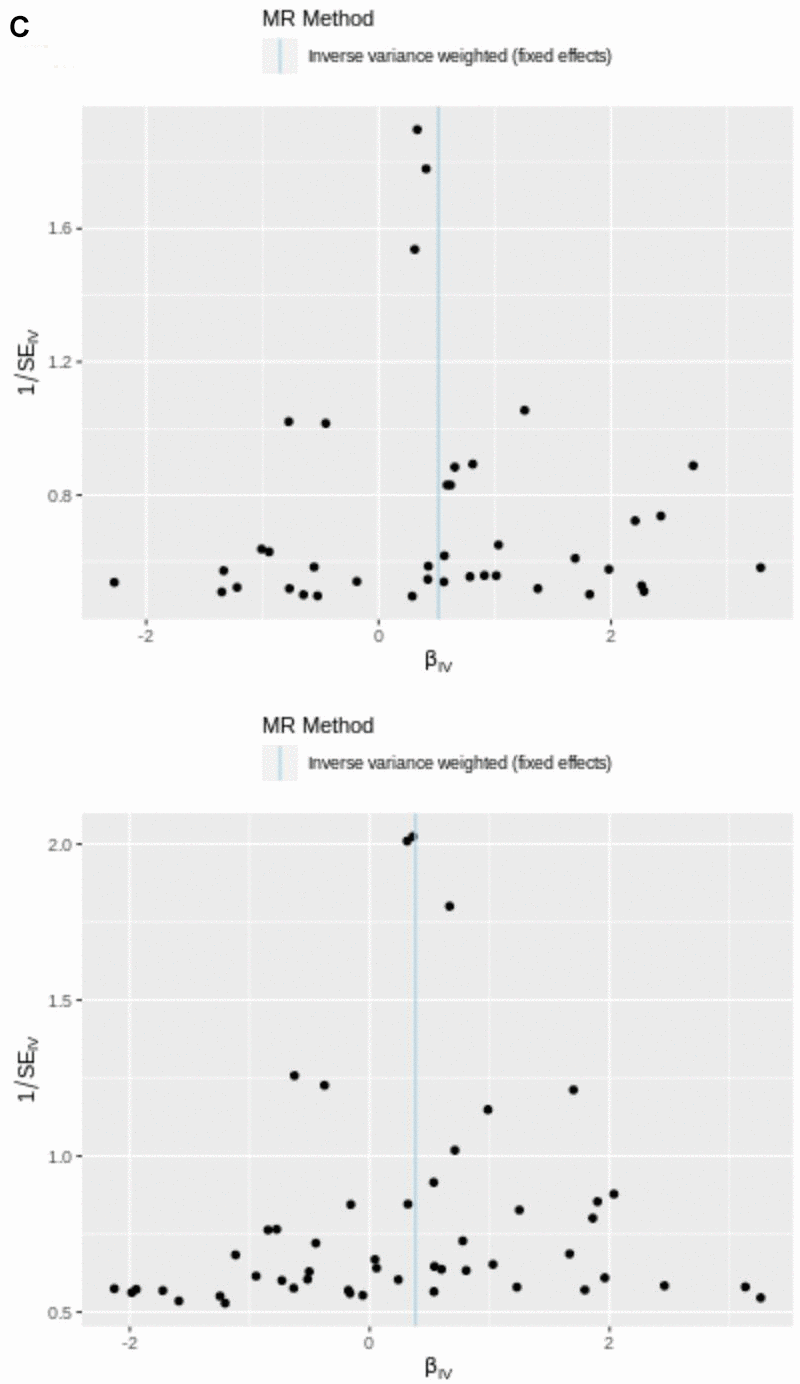
Figure 2.
(
C
) IVW line in funnel plot. SNPs exhibited a symmetrical distribution on either side of IVW line in funnel plot. This observation suggests that MR analysis adhered to Mendel’s second law.