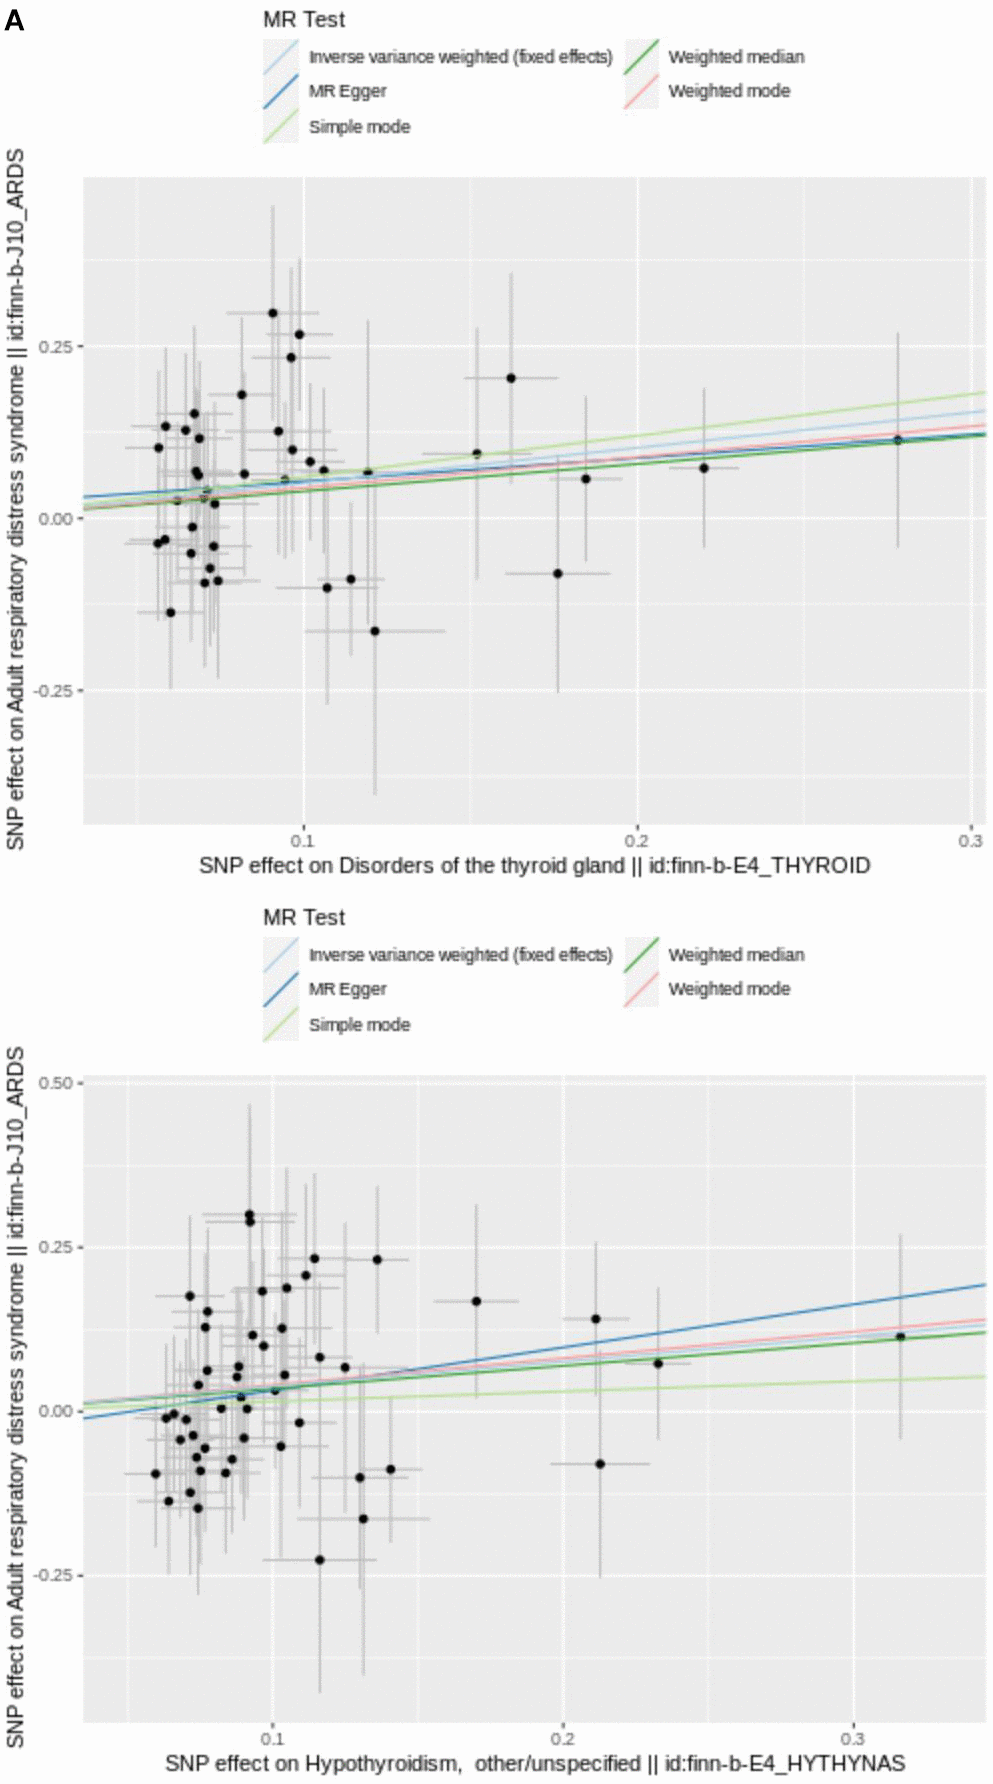
Figure 2.(A) Scatter plot of SNPs relevant to DTG, hypothyroidism and ARDS. Each splash displayed the effect sizes for SNP relation (x-axis, SD units) and SNP-ARDS relation (y-axis, log (OR)) with 95% CIs. Using three MR strategies (IVE, MR-Egger, and weighted median), the regression slopes of the lines associated with the causal estimates were determined.
() The utilization of a funnel plot. The utilization of a funnel plot as a means to assess the robustness of a study is being considered. The dispersed data points represent the approximate impact of a solitary SNP employed as an IV. Global estimate was depicted by the vertical lines, which were obtained using IVW approach using MR-Egger regression.
() IVW line in funnel plot. SNPs exhibited a symmetrical distribution on either side of IVW line in funnel plot. This observation suggests that MR analysis adhered to Mendel’s second law.
() Plot of LOO. Each row was considered an independent MR analysis to estimate causal effect using all of remaining IVs except for single SNP listed on y-axis. Additionally, all data points were required to be greater than zero on the x-axis.