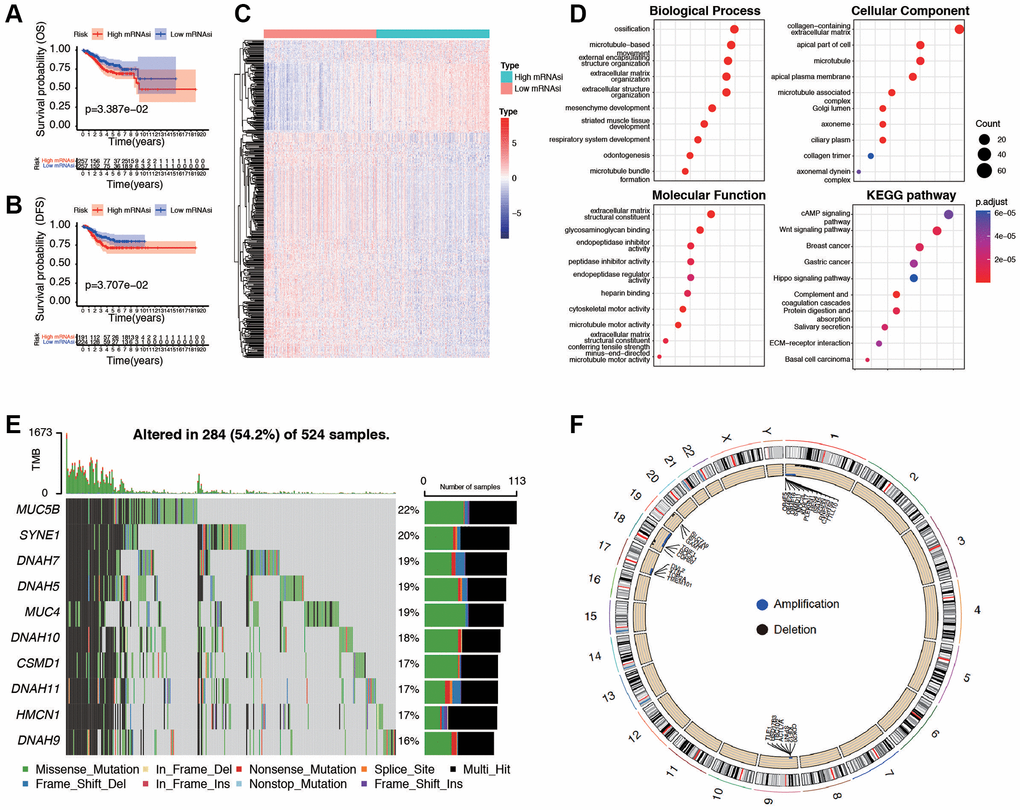
Figure 3.Evaluation and differential expression analysis between low and high mRNAsi groups. (A, B) Overall Survival curve and Disease-Free Survival curve of patients in low and high mRNAsi group. (C) Heatmap of differentially expressed genes (DEGs) between the mentioned two groups. (D) GO and KEGG functional analysis of DEGs. (E) Landscape of the top ten mutation DEGs profiles in EC samples. Mutation information of each gene in each sample was shown in the waterfall plot, where different colors with specific annotations at the bottom meant the various mutation types. The bar plot above the legend exhibited the number of tumor mutation burden (TMB). (F) The differential analysis of copy number variations between low and high mRNAsi groups was visualized by Circos plot, which revealed that compared with the low mRNAsi group. Blue dots represented amplifications, black dots represented deletions, and grey dots represented no significant CNAs.