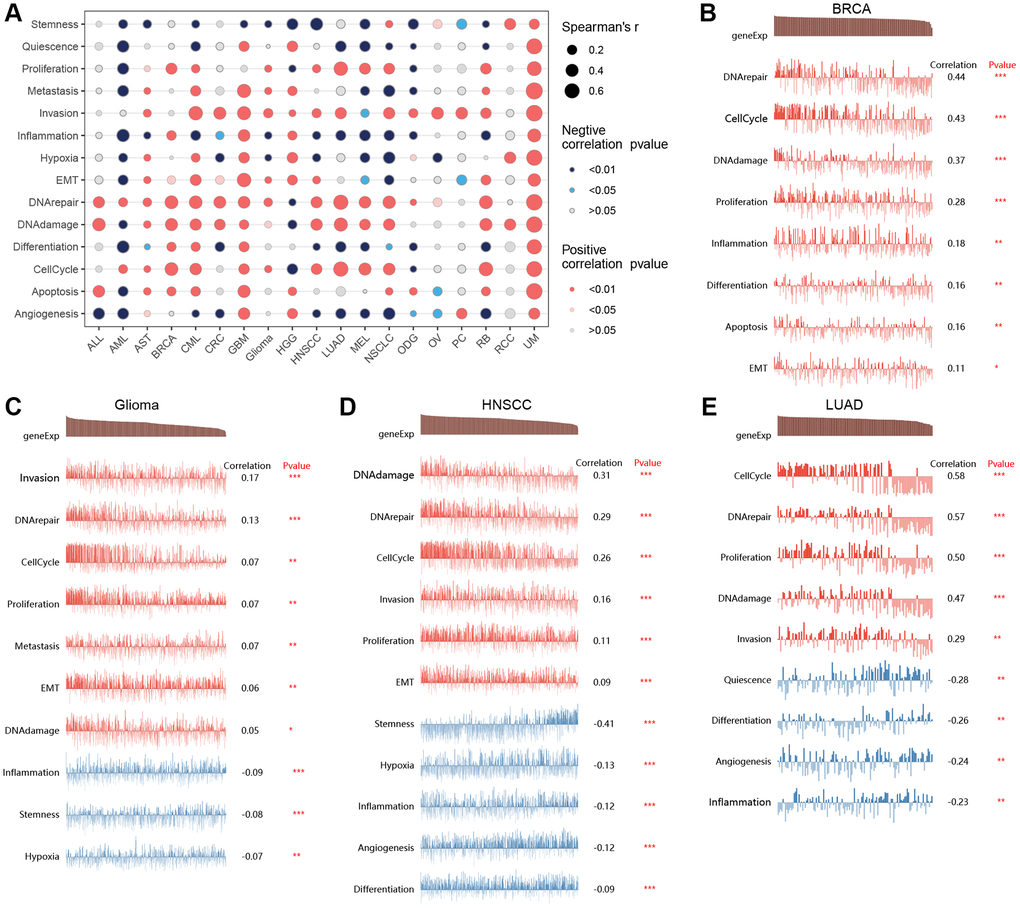
Figure 9.Single-cell analysis. The correlation between T-cell proliferation regulatory genes and cancer-related functional states (A). The correlation between T-cell proliferation regulatory genes and cancer-related functional states in BRCA (B), Glioma (C), HNSCC (D), and LUAD (E).