Submit an Article
Navigate
Home
Editorial Board
Editorial Policies
Current Volume
Archive
Scientific Integrity
Publication Ethics Statements
Interviews with Outstanding Authors
Newsroom
Sponsored Conferences
Podcast
Contact
Special Collections
Submit an Article
Online ISSN: 1945-4589
Research Paper
|
Volume 16, Issue 15
|
pp. 11535–11552
Exploring the mechanism by which
Angelica sinensis
improves haematopoietic function in aplastic anaemia
Back to article
Figure 2
(2 of 9)
−
100%
+
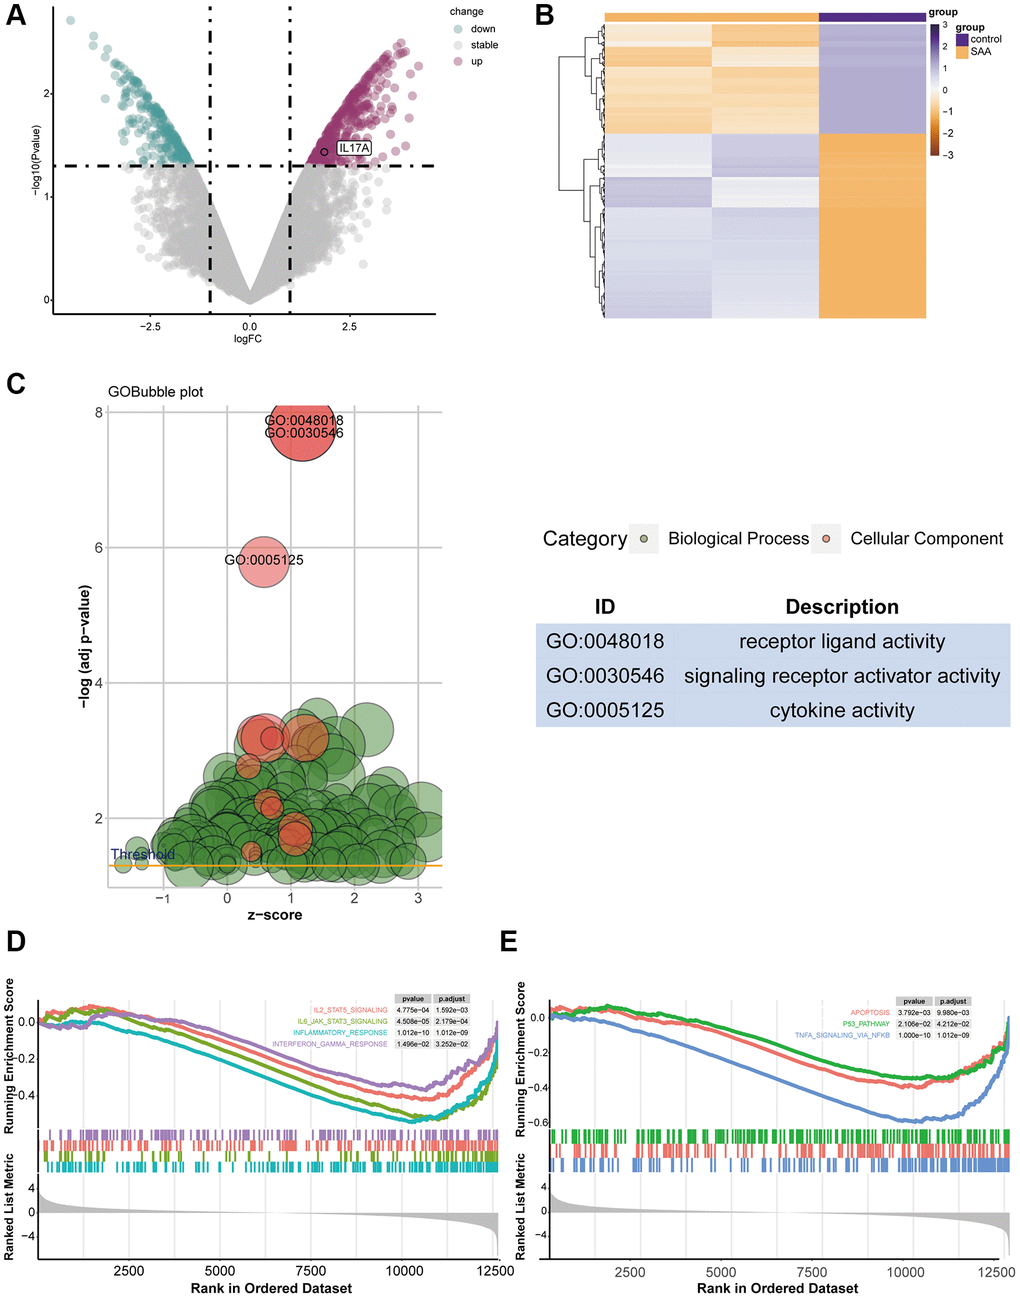
Figure 2.
The result of DEG identification.
(
A
) DEGs in GSE3807. (
B
) Heatmap of 1089 DEGs screened. (
C
) Gene Ontology (GO) enrichment analysis for DEGs. (
D
,
E
) Gene set enrichment analysis (GSEA) of DEGs.