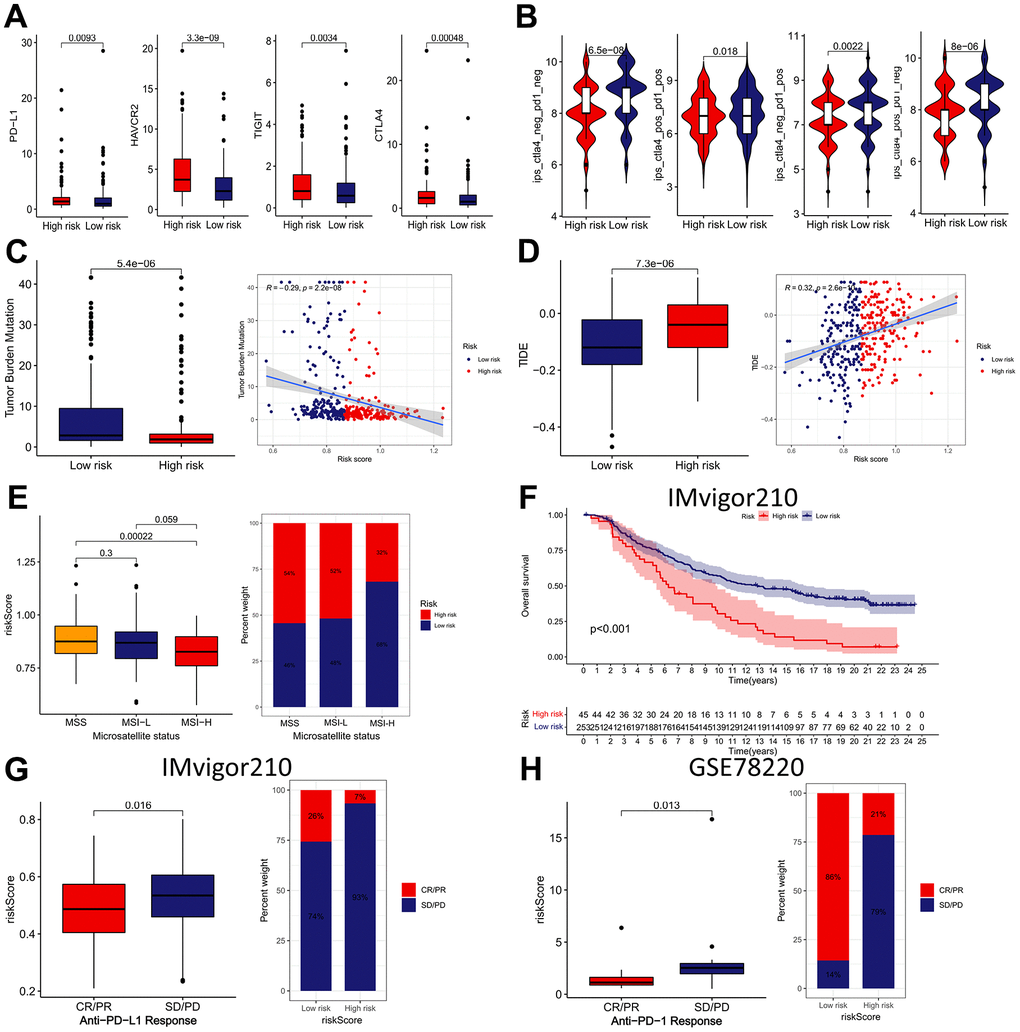
Figure 11.The immunotherapeutic benefit of the IRRS model. (A) The expression of four ICBs (PD-L1, HAVCR2, TIGIT, and CTLA4) in low- and high-risk groups. (B) The difference in IPS scores between low- and high-risk groups. (C) Box plots and scatter diagram of the TMB score and IRRS. (D) Box plots and scatter diagram of the TIDE score and IRRS. (E) Boxplot and Bar diagram of the microsatellite instability and IRRS. (F) Kaplan–Meier curve of OS for patients with high and low IRRS subtypes in IMvigor210 cohort. (G) Boxplot and Bar diagram displayed the response to immunotherapy in low- and high-risk groups in IMvigor210 cohort. (H) Boxplot and Bar diagram displayed the response to immunotherapy in low- and high-risk groups in GSE78220 cohort.