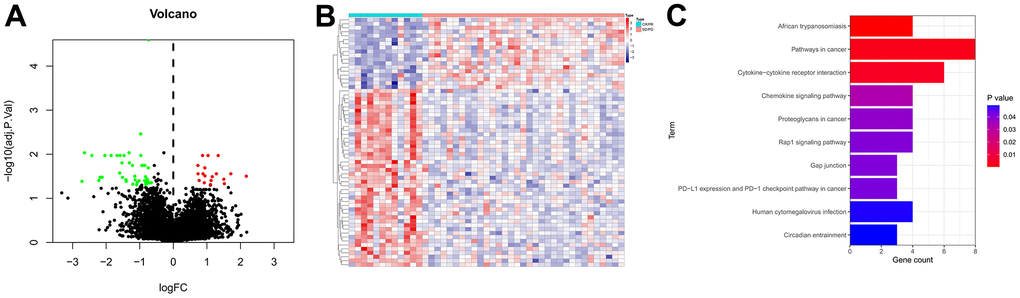
Figure 1.Identification of IRGs. (A) Volcano plot of IRGs. The red dots represent the upregulated genes, the green dots represent the downregulated genes, and the black dots represent genes with no significant difference in expression. (B) Expression heatmap of the IRGs. Red represents upregulated genes, and blue represents downregulated genes. (C) KEGG enrichment analysis of the IRGs.