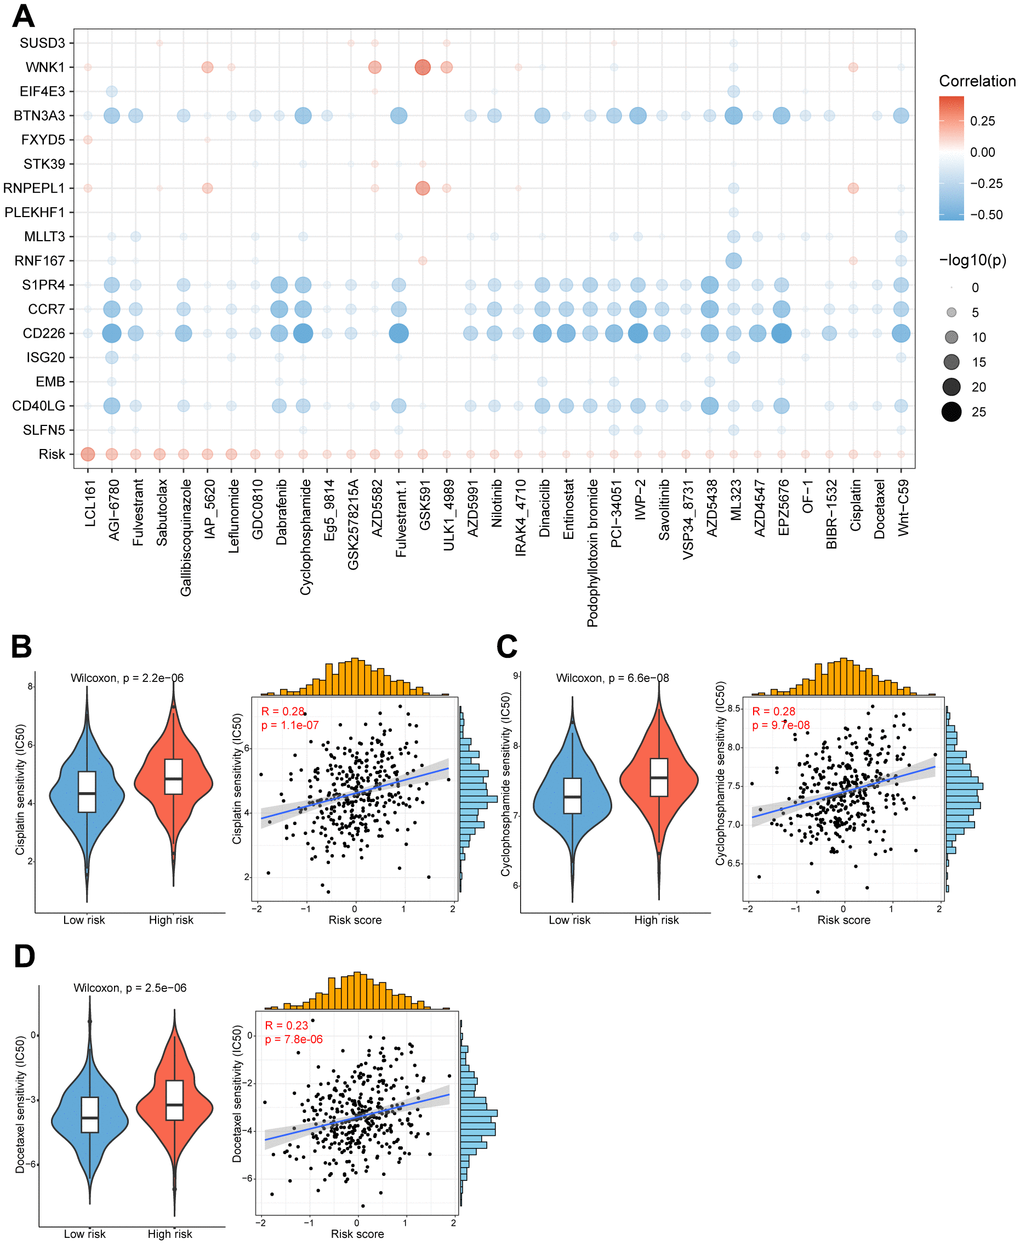
Figure 6.High/low-risk group patients differ in drug sensitivity and response to immunotherapy. (A) Bubble plot showing the relationship between drugs, risk score, and model genes. (B) Violin plot showing the comparison of IC50 of cisplatin between high/low-risk groups, and scatter plot showing the correlation between the IC50 of drugs and the risk score. (C) Violin plot showing the comparison of IC50 of cyclophosphamide between high/low-risk groups, and scatter plot showing the correlation between the IC50 of drugs and the risk score. (D) Violin plot showing the comparison of IC50 of docetaxel between high/low-risk groups, and scatter plot showing the correlation between the IC50 of drugs and the risk score.