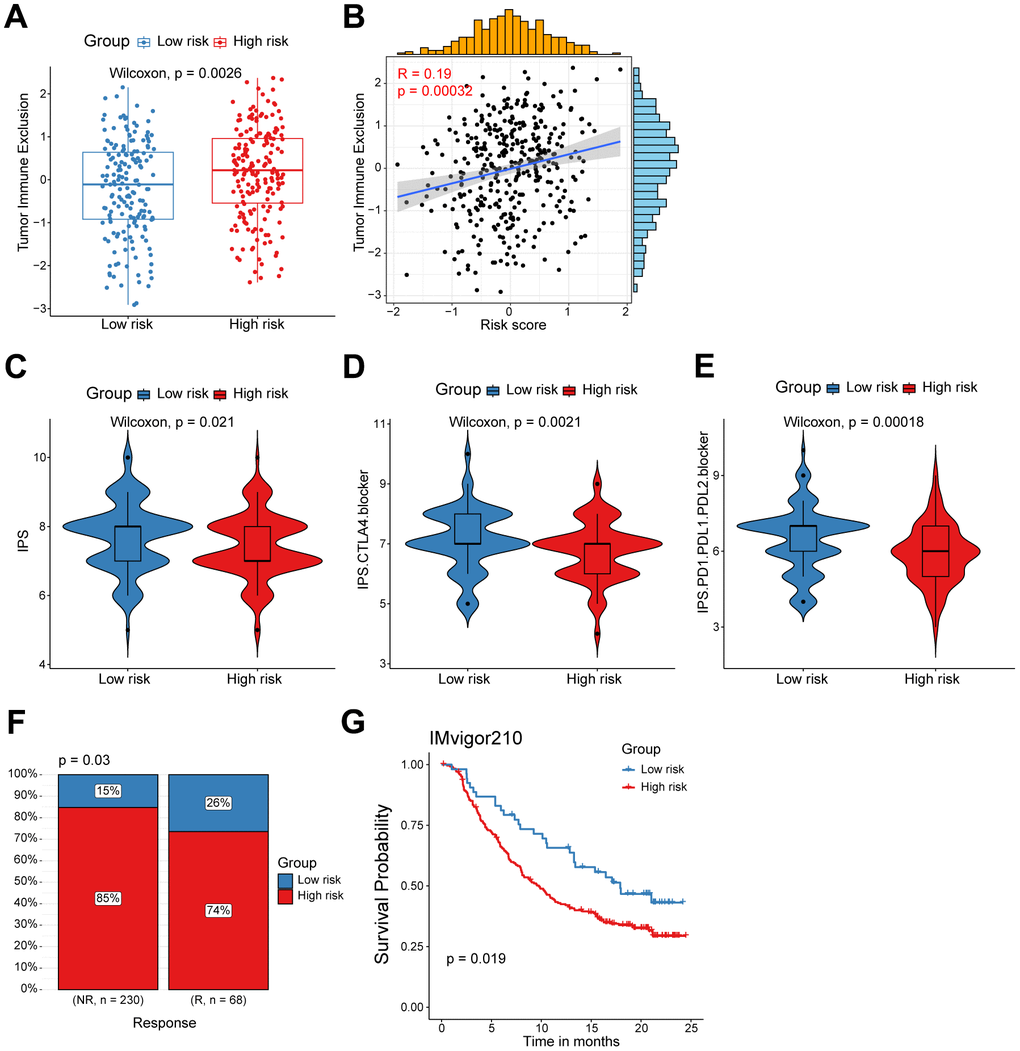
Figure 5.High/low-risk group patients differ in response to immunotherapy. (A) Tumor Immune Exclusion score in high/low-risk groups. (B) Spearman correlation between Tumor Immune Exclusion score and risk score. (C–E) Immunophenoscore (IPS) in high/low-risk groups. (F) Proportion of immunotherapy responses between high/low-risk groups. (G) Kaplan-Meier survival analysis was performed on the relationship between the risk score and OS in the IMvigor210 immunotherapy cohort.