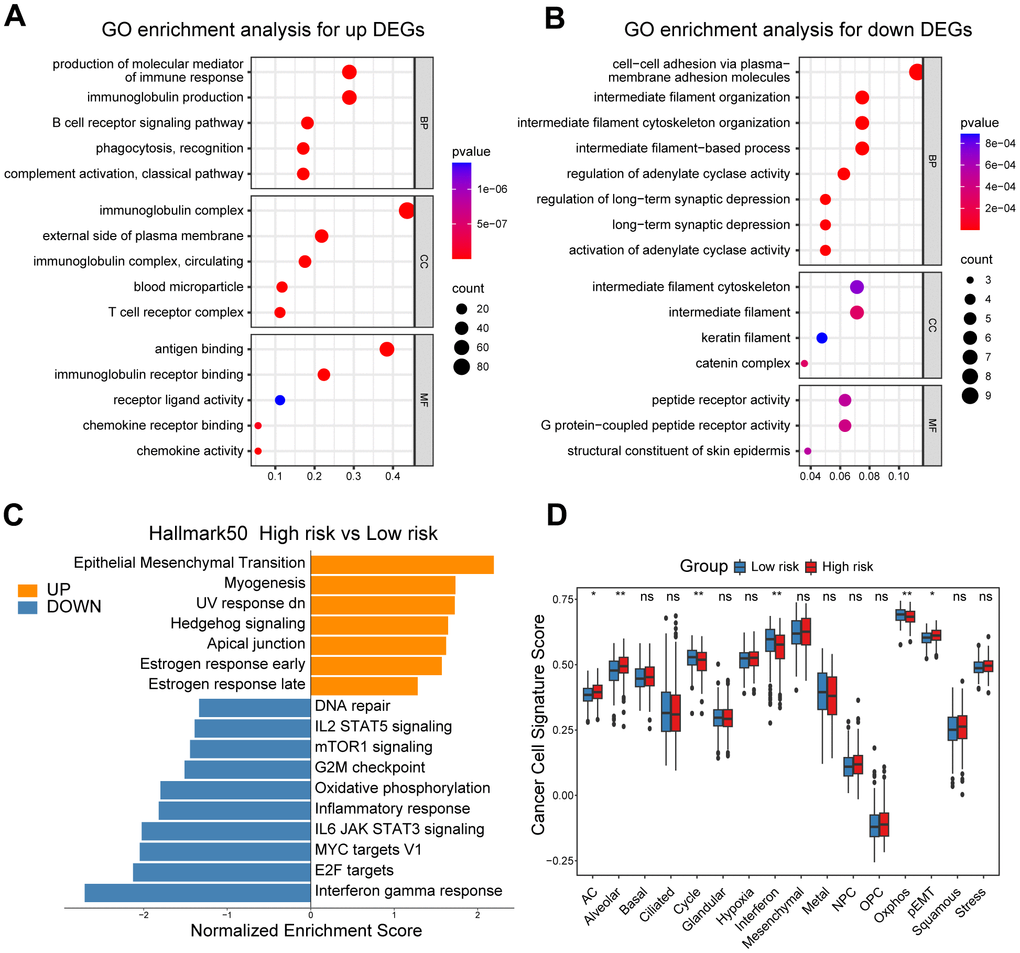
Figure 3.Functional and genomic features of high/low-risk group patients. (A, B) GO enrichment of DEGs in high/low-risk groups. (C) Bar plot showing different pathways enriched in high/low-risk groups of ovarian cancer calculated by GSEA. (D) Boxplots showing the signature score of 16 cancer cell states in high/low-risk groups of ovarian cancer scored by GSVA. Paired two-sided Wilcoxon test. The asterisks represent the statistical P-value (*p<0.05; **p<0.01; ***p < .001; ****p < 0.0001; ns p>0.05).