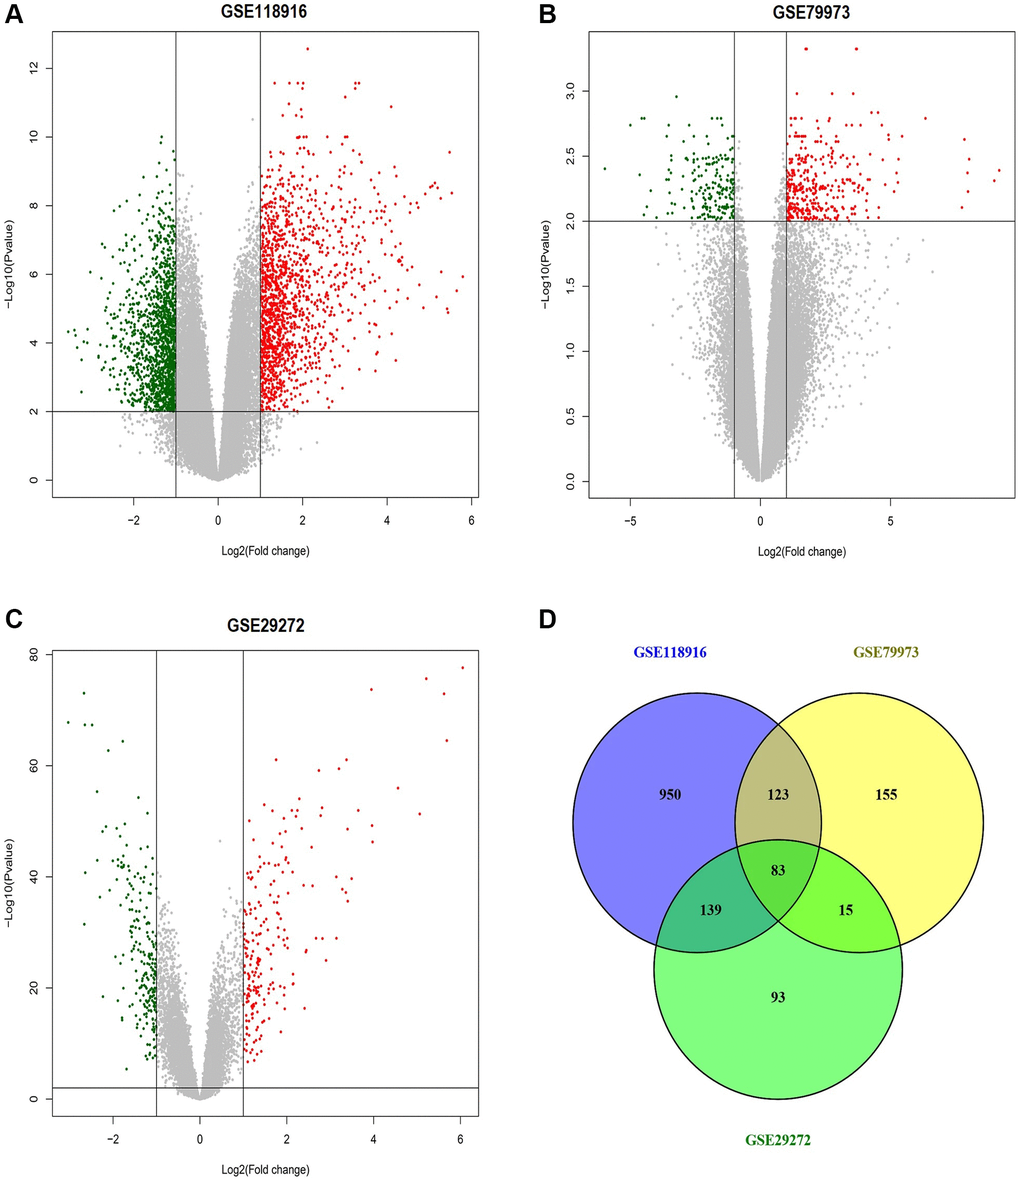
Figure 2.This figure depicts the process of identifying differentially expressed genes (DEGs) across the GSE118916, GSE79973, and GSE29272 datasets related to gastric cancer (GC). (A) Volcano plot of differentially expressed genes (DEGs) in the GSE118916 dataset. (B) Volcano plot of DEGs in the GSE79973 dataset. (C) Volcano plot of DEGs in the GSE29272 dataset. (D) Venn diagram showing the overlap of DEGs among the three datasets (GSE118916, GSE79973, and GSE29272). Red dots represent up-regulated genes, and green dots represent down-regulated genes. The numbers in Venn diagram represent the count of unique and overlapping genes among the datasets. P-value < 0.05.