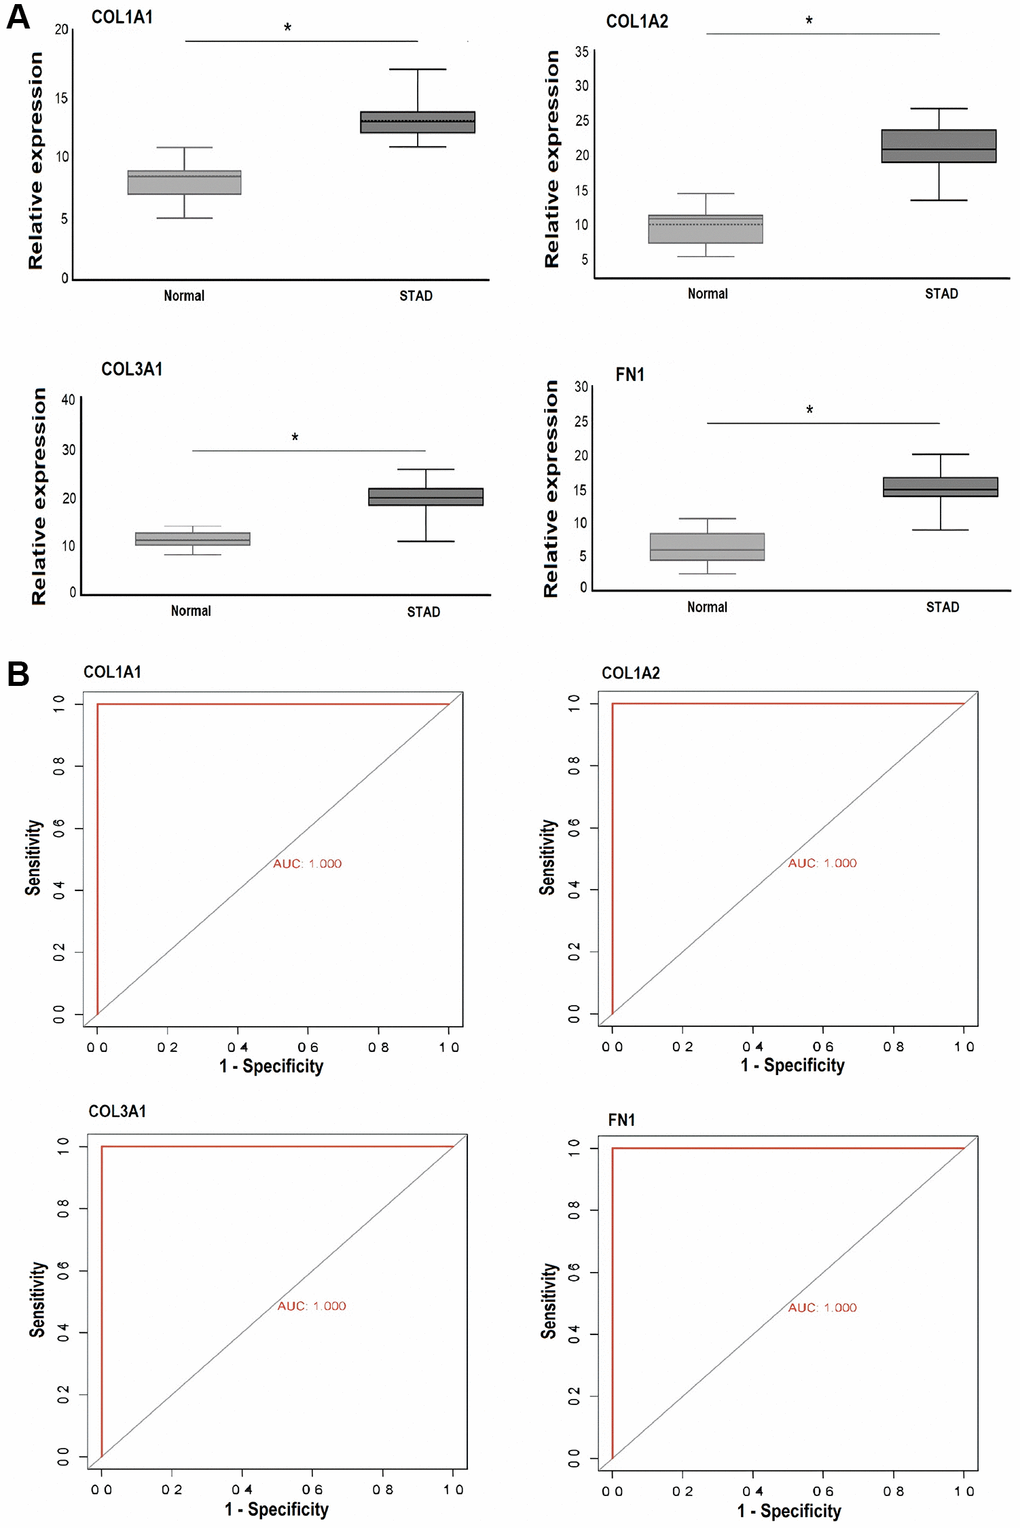
Figure 10.This figure depicts the relative expression and receiver operating characteristic (ROC) curve analysis of COL1A1, COL1A2, COL3A1, and FN1 in Pakistani gastric cancer (GC) patients and normal controls. (A) Presents the relative expression analysis of these genes in Pakistani GC patients and control samples via RT-qPCR. (B) Shows the ROC curves based on RT-qPCR expression of COL1A1, COL1A2, COL3A1, and FN1. A significance level of P < 0.05 was utilized as the selection criteria. P-value < 0.05.