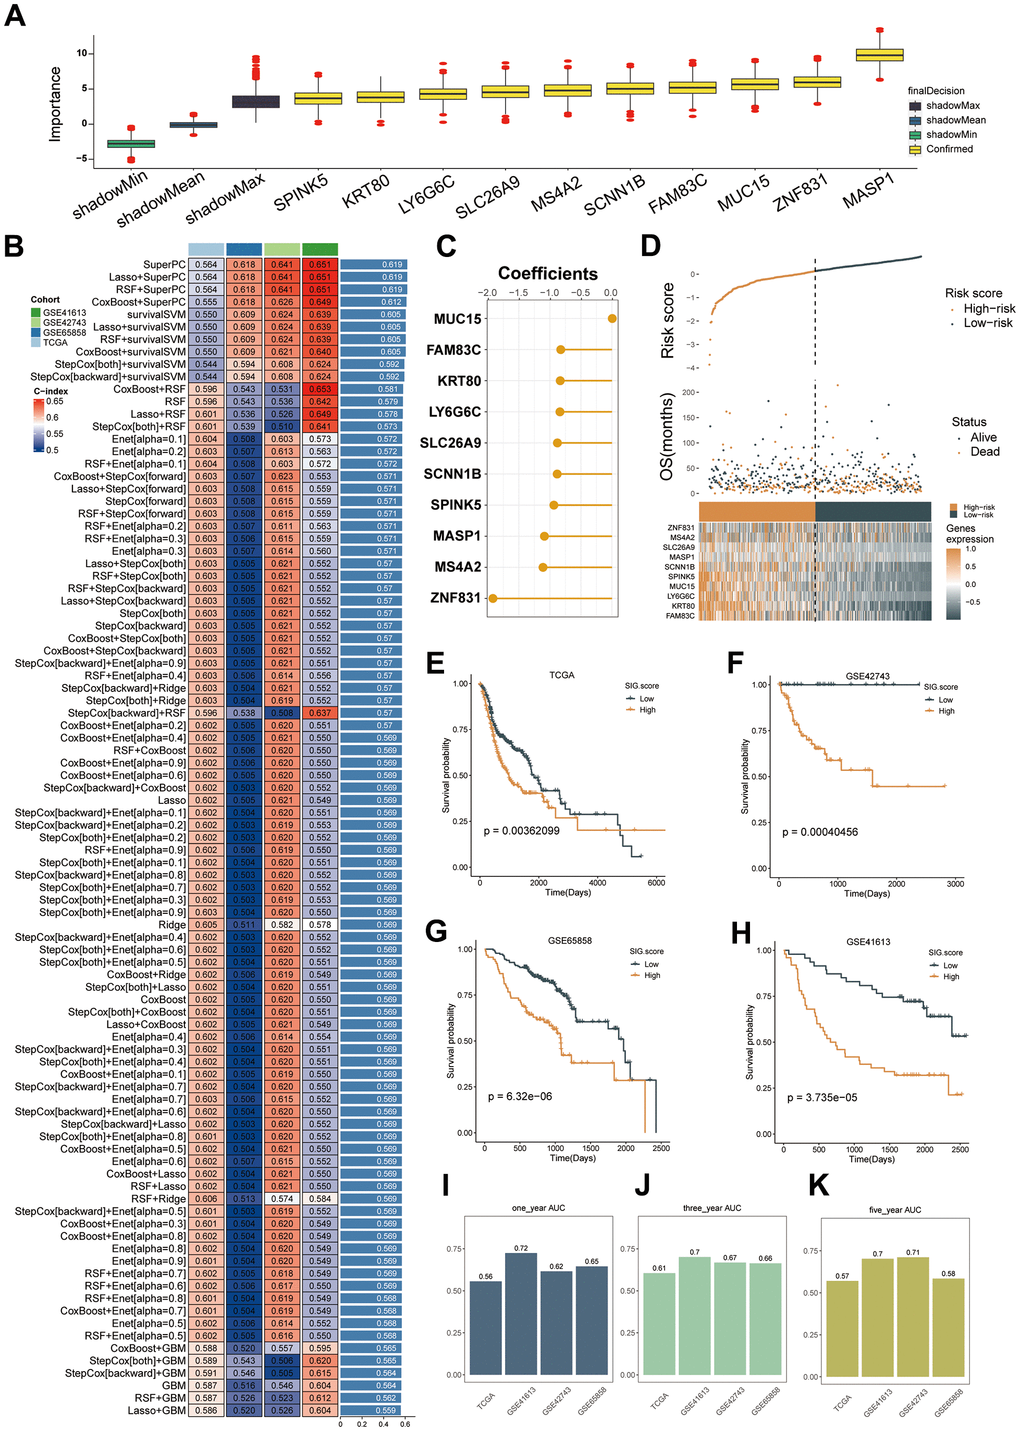
Figure 6.Machine learning-based gene signatures based on mitophagy subgroups. (A) The Boruta algorithm identified 10 mitophagy-related genes. Yellow represents confirmed features while other colors denote shadow attributes. The corresponding boxplots compared the concordance index (C-index) values. (B) Machine learning was used to build 93 different models, and their C-indices were tested in each verification set. (C) The coefficients of ten genes calculated by SuperPC. (D) Statistical analysis of the risk scores and survival status of ten genes as well as their expression characteristics in TCGA. (E–H) Prognoses of patients in the TCGA (E), GSE42743 (F), GSE65858 (G), and GSE41613 (H) sets. (I–K) Predicting patient survival at 1, 3, and 5 years using the MSRS.