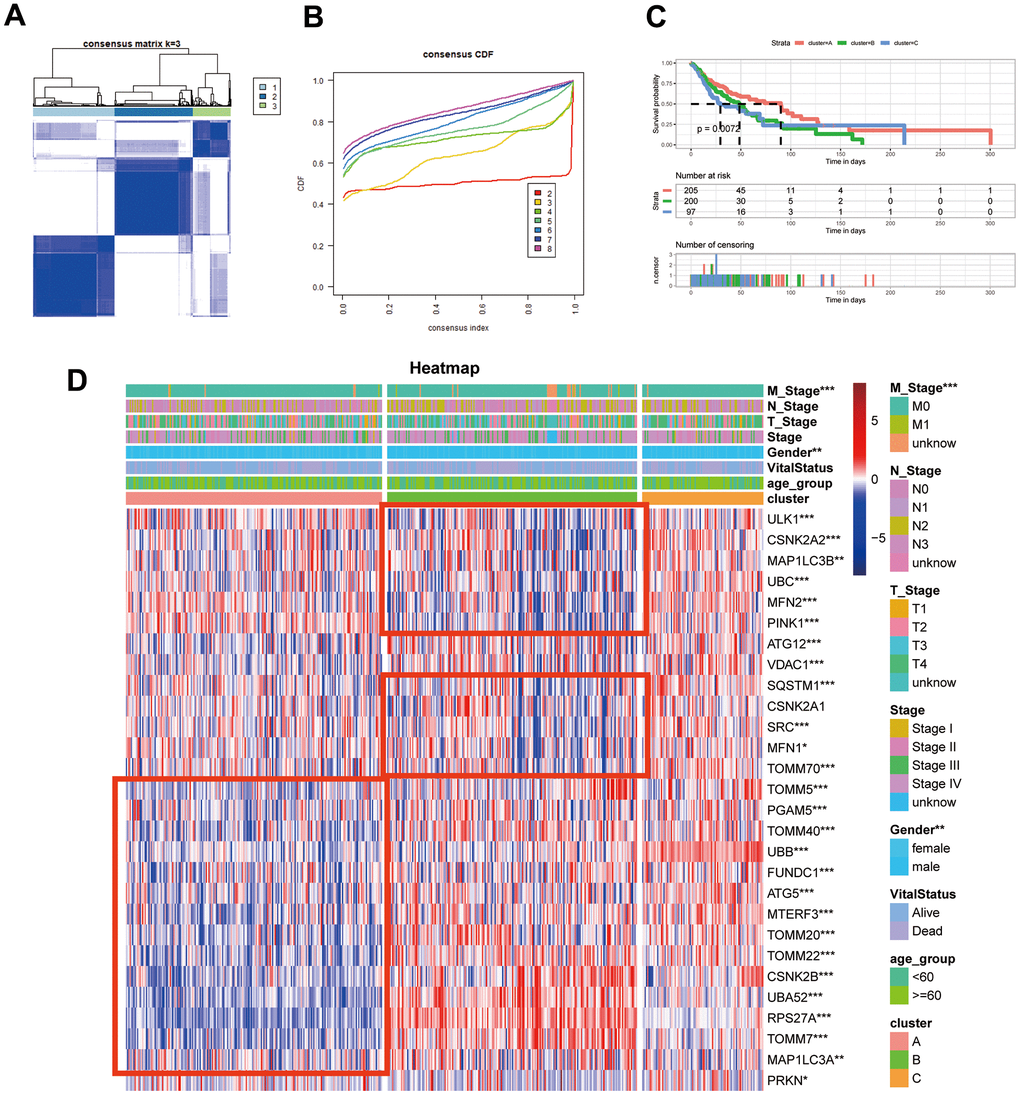
Figure 3.Identification of mitophagy subtypes of HNSCC. (A) Consensus matrix of samples in TCGA-HNSC for k=3. (B) The cumulative distribution function curves for k = 2 to 8. (C) Kaplan-Meier survival analysis for overall survival of the three subtypes in TCGA-HNSC dataset. (D) The expression profiles of the mitophagy regulators in three subtypes and normal kidney samples. Statistical significance denoted as ****p < 0.0001, ***p < 0.001, **p < 0.01, *p < 0.05.