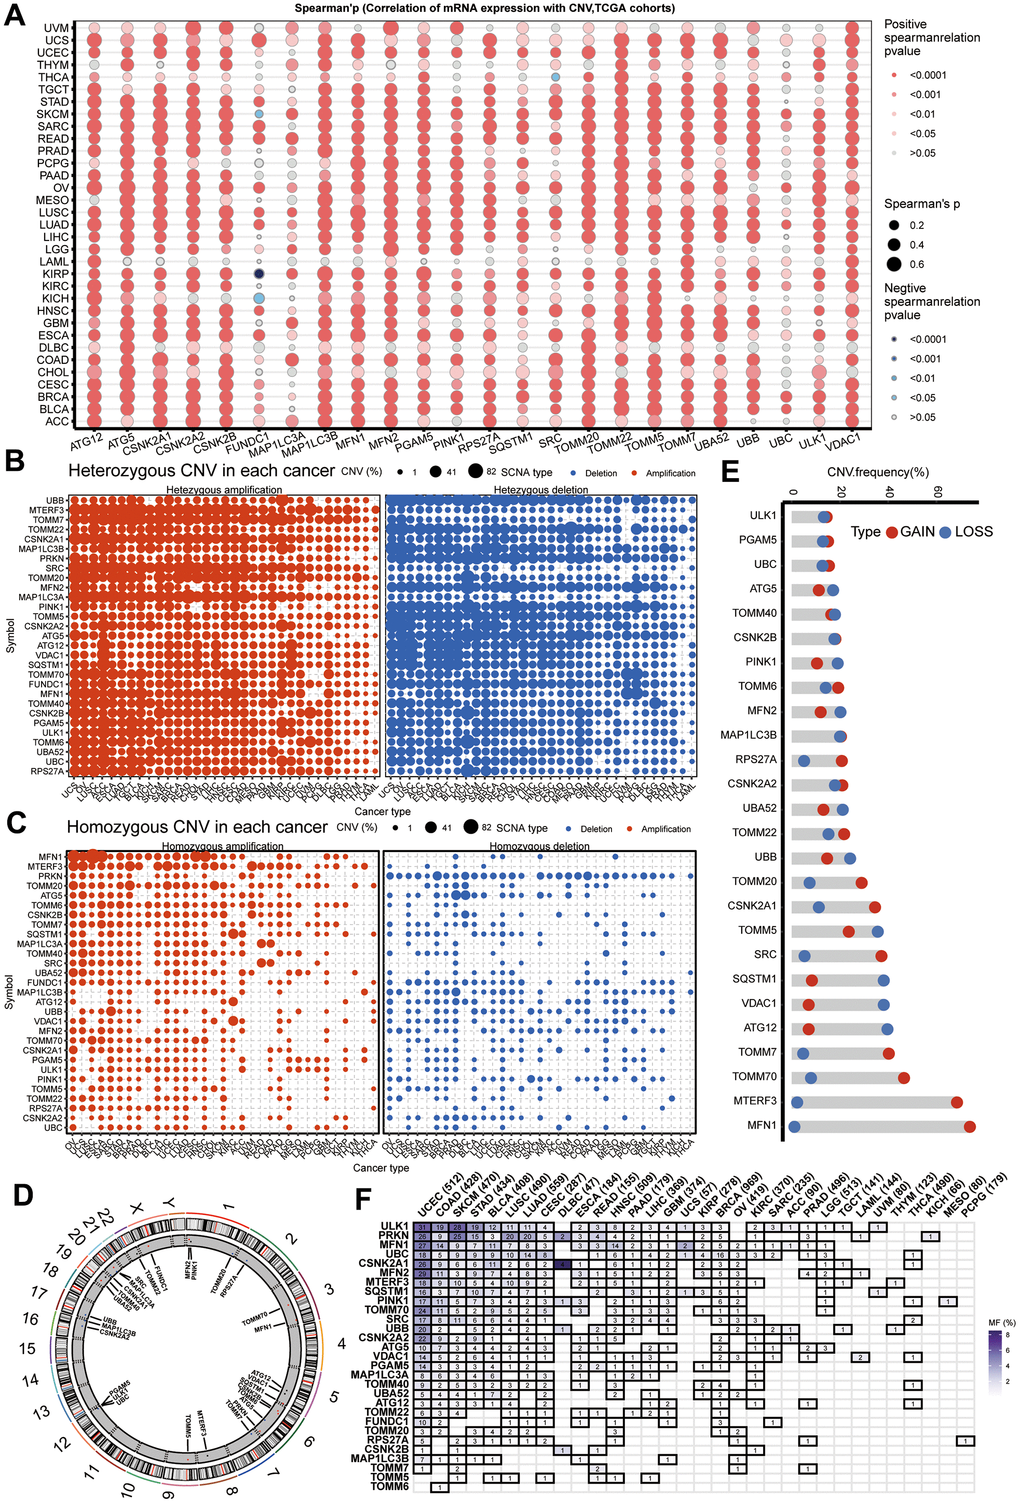
Figure 2.CNV and sequence alteration contribute to abnormal mitophagy genes Levels. (A) CNV strongly correlates to gene expression of mitophagy regulators in pan-cancer using spearman analysis. (B, C) Heterozygous and homozygous amplification/deletion of mitophagy regulators in pan-cancer. Amplification, red; Deletion, blue. (D) The location of CNV of mitophagy regulators on 23 chromosomes. (E) CNV of mitophagy regulators in TCGA-HNSC dataset. CNV loss, blue; CNV gain, red. (F) Mutation frequency of mitophagy regulators in pan-cancer.