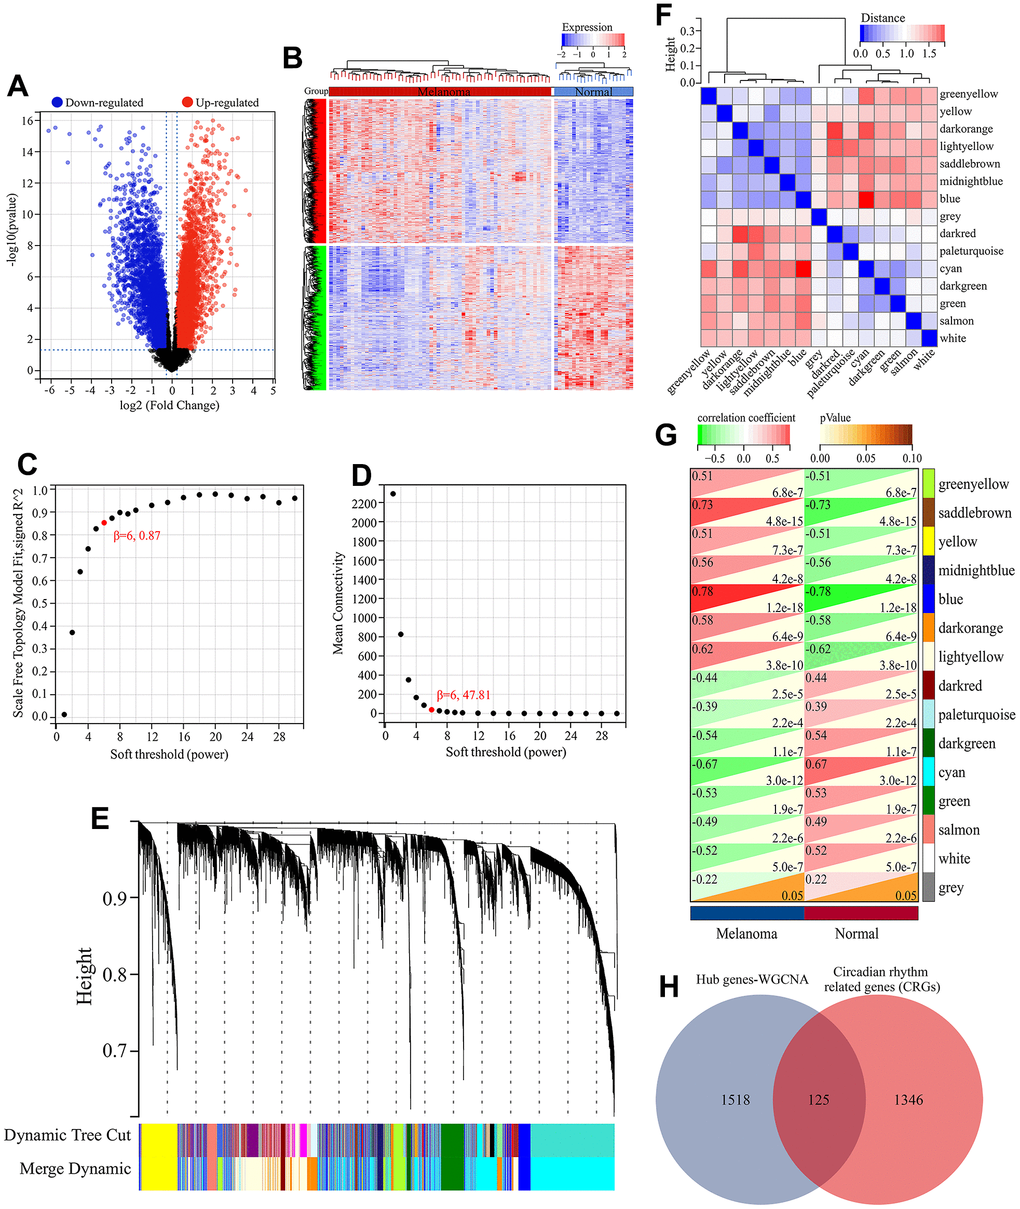
Figure 2.Screening of melanoma-related CRGs. (A) Volcano plot of differential expression analysis. (B) Heatmap of differential expressed genes. (C) Relationship between scale-free topology and soft thresholding power. (D) Average connectivity’s dependence on soft threshold power levels. (E) Hierarchical clustering dendrogram displaying distinct co-expression modules as individual colors. The bicolored rows beneath the tree indicate the initial and combined modules. (F) Cluster dendrogram of module eigengenes (MEs) and adjacency heatmap of MEs. (G) Correlation heatmap illustrating the association between module eigengenes (MEs) and clinical characteristics. (H) Screening of melanoma-related CRGs. The overlapping genes between hub genes in WGCNA and CRGs obtained from MSigDB database were defined as melanoma-related CRGs.