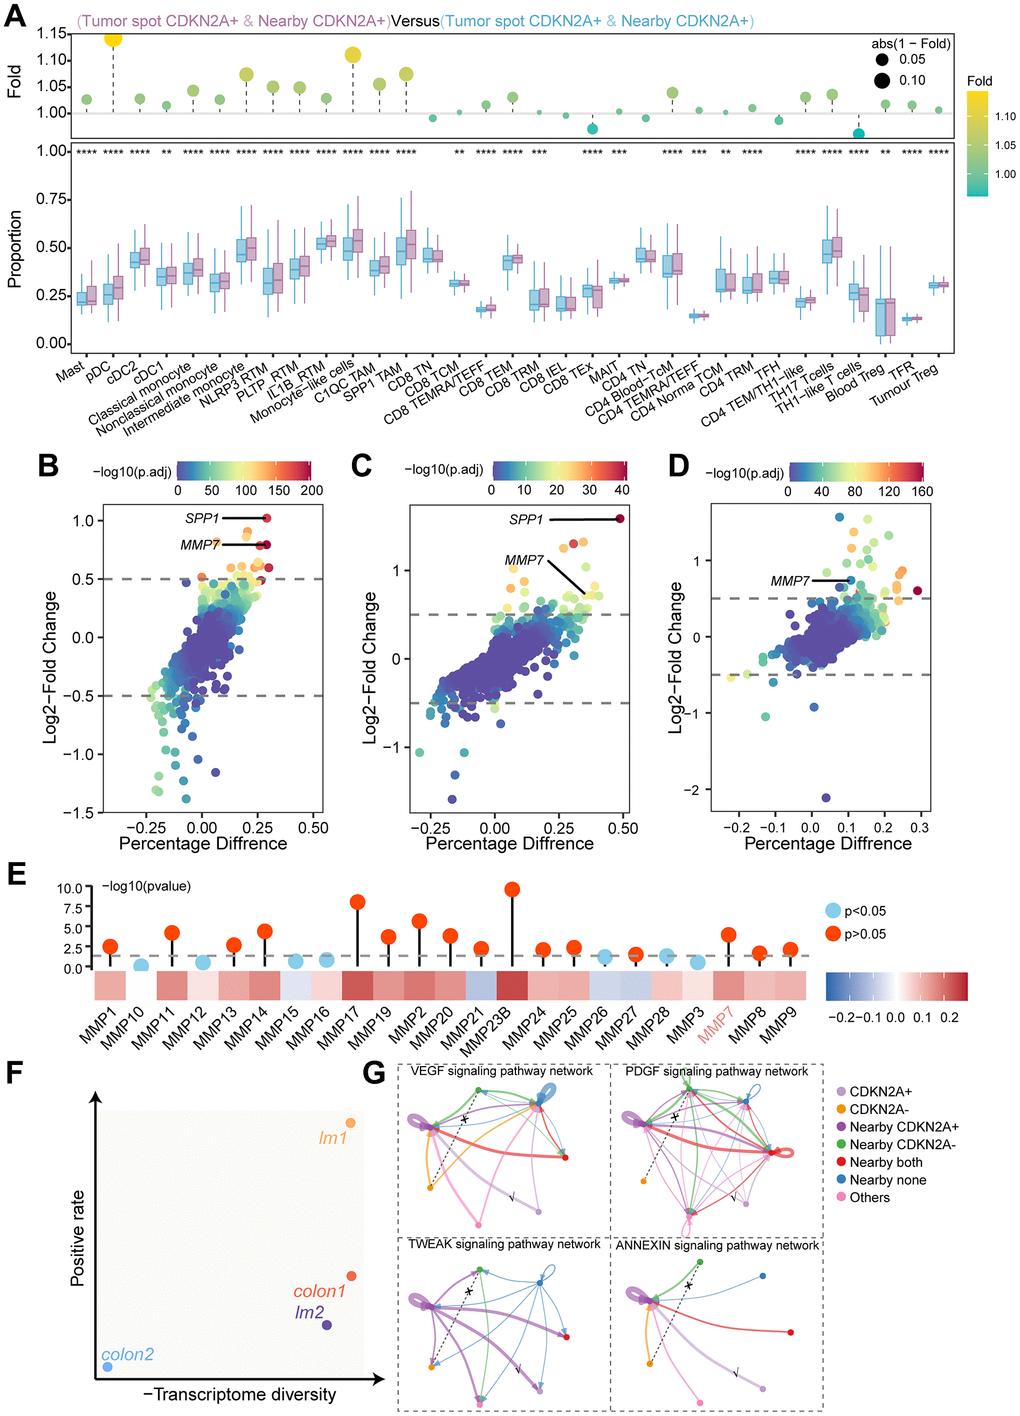
Figure 8.Immune cell infiltration, differential gene expression, and cellular communication networks in tumor regions and adjacent regions. (A) The ssGSEA algorithm evaluated the relationship between CDKN2A expression levels and immune cell infiltration levels in different regions of colorectal cancer. The lower box plot shows the difference in immune cell infiltration between the different regions, and the upper bar chart shows the fold change. Statistical significance was determined using the Wilcoxon test (***P < 0.001). (B) Within the TCGA cohort, high CDKN2A expression was associated with increased infiltration of SPP1 in TAMs. The Wilcoxon test was utilized for statistical analysis (**P < 0.01). (C) Differential gene analysis of CDKN2A+ tumor spots and CDKN2A- tumor spots in the spatial transcriptomics analysis. The x-axis represents the difference in the proportion of gene expression between the two groups, and the y-axis represents the fold change. (D) Differential gene analysis of nearby CDKN2A+ and nearby CDKN2A- regions in spatial transcriptomics analysis. (E) Differential gene analysis of tumor epithelial cells expressing CDKN2A and those not expressing CDKN2A in the scRNAseq cohort. (F) Heatmap showing the correlation between the expression levels of CDKN2A and MMPs in TCGA the cohort. The bar chart above represents the significance of P-values, with different colors indicating statistical significance. The statistical method used was the Spearman rank test. (G) Transcriptional heterogeneity and expression rate of CDKN2A in all samples, where the x-axis represents the inverse of the transcriptional heterogeneity score, and the y-axis represents the expression rate of CDKN2A. (H) Cell communication network diagram between tumor spots and adjacent spots.