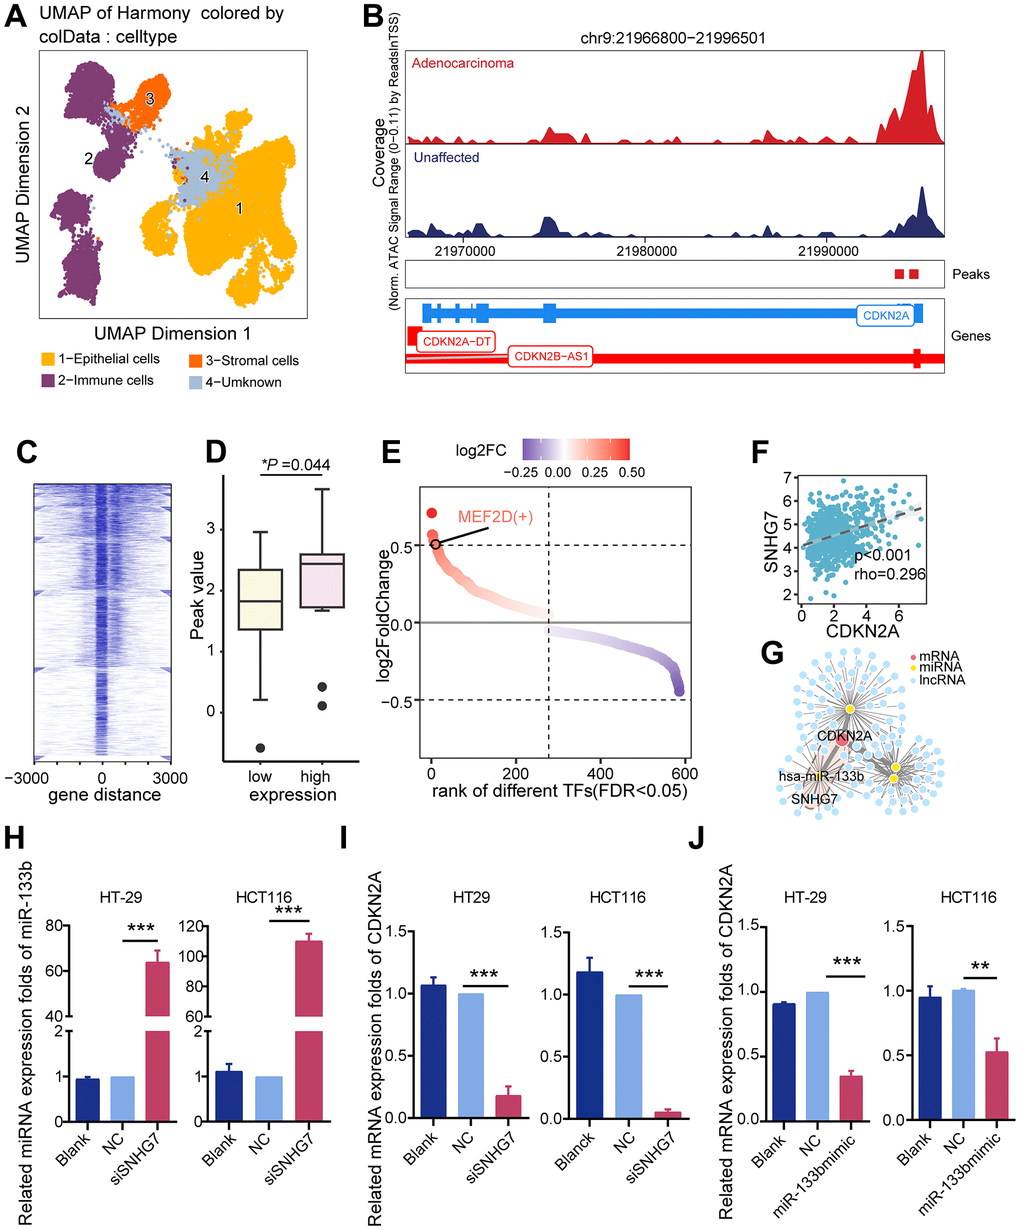
Figure 3.Potential regulatory mechanisms of CDKN2A. (A) UMAP dimension reduction plots showing annotated cell clusters, with different colors representing different cell types. (B) Genome accessibility trajectory around CDKN2A in tumor epithelium and normal epithelium cells, with peaks called in the scATAC data and peaks-to-gene links indicated below the tracks. (C) TSS distribution heatmap for the ATAC-seq data in the TCGA colorectal cancer cohort. (D) Peak value differences in CDKN2A sites between the CDKN2A high and low expression groups in the TCGA colorectal cancer cohort, *P < 0.05, Wilcoxon test. (E) Transcription factors predicted by Pyscenic to potentially regulate CDKN2A, ranked based on the fold difference in AUCell values for each point. (F) A ceRNA regulatory network was constructed based on differentially expressed genes, with the SNHG7/miR-133b/CDKN2A regulatory axis being the most relevant potential regulatory network. (G) Scatter plot showing the CDKN2A and SNHG7 expression levels, the Spearman rank test. (H) qRT-PCR analysis was performed to assess the influence of silencing SNHG7 on miR-133b expression levels in CRC cell lines. (I) qRT-PCR analysis was conducted to investigate the influence of SNHG7 knockout on CDKN2A expression levels in CRC cell lines. (J) qRT-PCR analysis was employed to determine the effects of miR-133b mimic and miR-133b inhibitor transfection on CDKN2A expression levels in CRC cell lines.