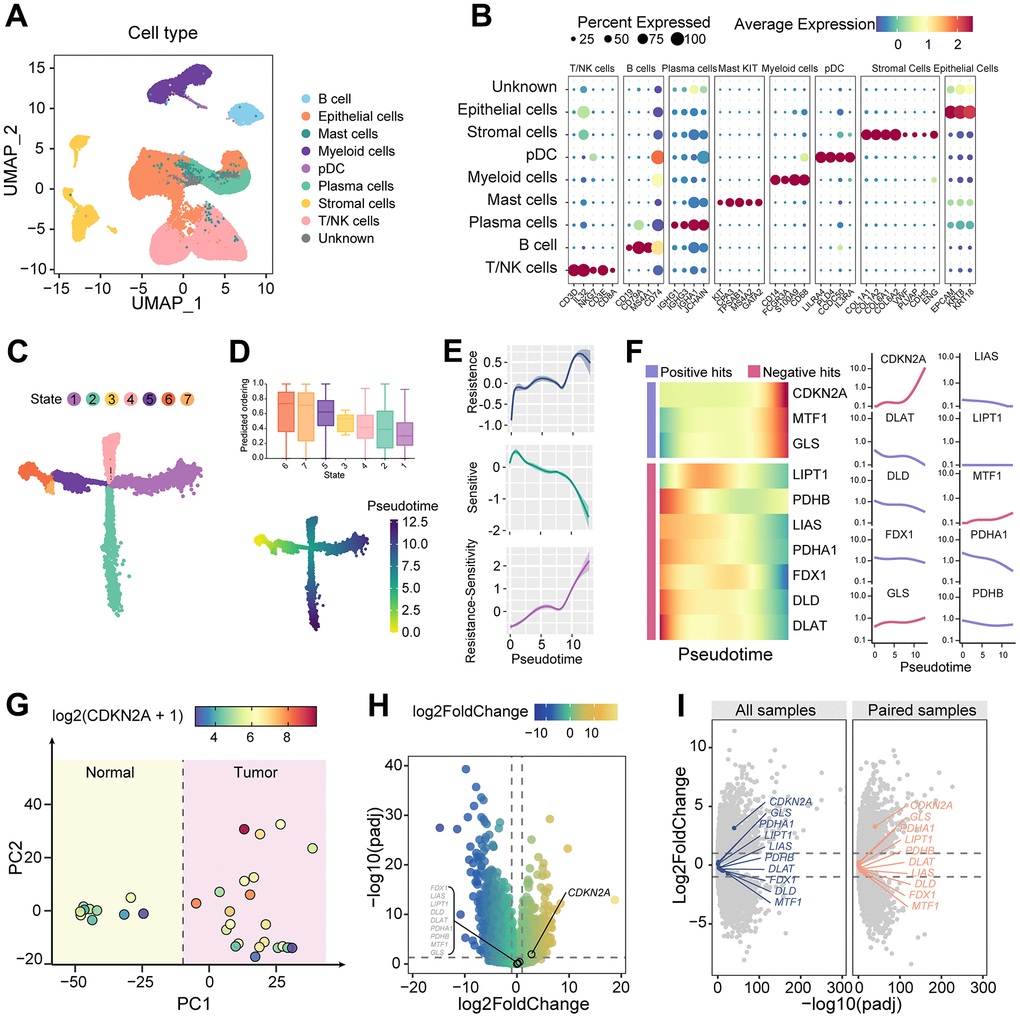
Figure 1.Dynamic alterations of cuproptosis characteristics. (A) UMAP dimension reduction plots showing cell clusters identified by scRNAseq. (B) Expression of marker genes of different cell clusters. (C) Evolution trajectory of tumor epithelial cells, which are divided into seven states. (D) TOP: CytoTRACE predicts the evolutionary stage of each state. Bottom: pseudotime in the evolutionary trajectory. (E) Shaded line plot indicating the resistance score, sensitivity score, and the difference between the two for cuproptosis in tumor epithelium along pseudotime. (F) Heatmap and line plot showing cuproptosis-related genes arranged in pseudotime. (G) PCA map of the cell count matrix obtained from pseudobulk analysis. (H) Differential gene expression analysis of genes obtained from pseudobulk analysis. (I) Differential gene analysis between tumor and normal samples, as well as between tumor and paired samples, using the TCGA colorectal cancer cohort.