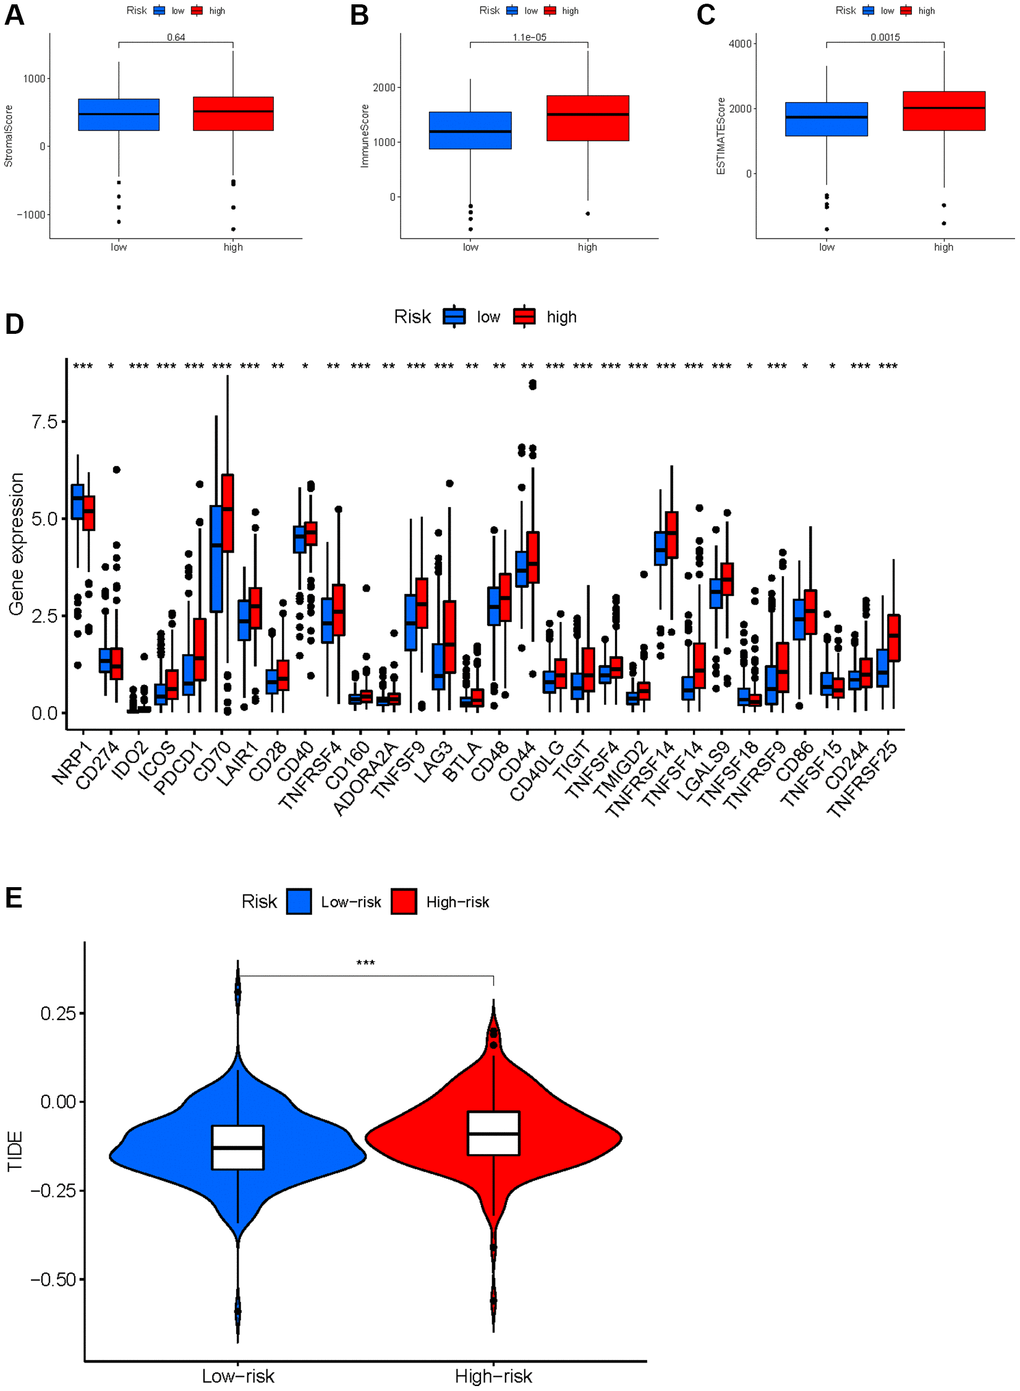
Figure 14.Correlation between HMs-based signature and immune characteristics. (A–C) Analysis of the tumour microenvironment between high- and low-risk groups by ESTIMATE algorithm. (D) Analysis of differences in immune checkpoint expression between high- and low-risk groups. (E) Analysis of differences in TIDE scores between high- and low-risk groups.