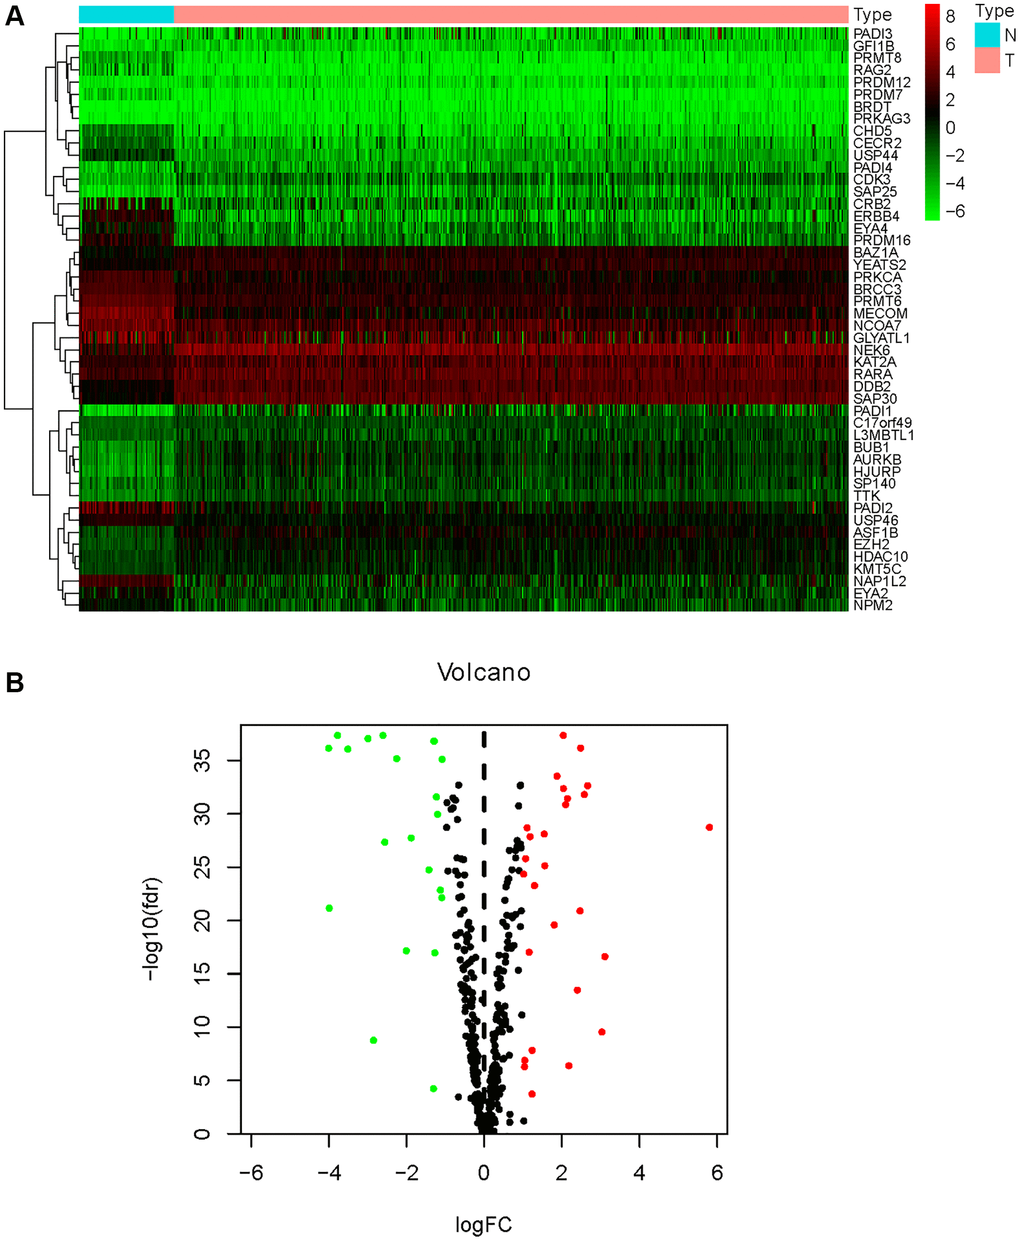
Figure 1.Differential expression analysis of HMs. (A) The heatmap displayed the differential expression of HMs between KIRC samples and normal control samples. Red represented up-regulation of HMs expression, green represented down-regulation of HMs expression. (B) Volcano displayed the differential expression of HMs in KIRC samples.