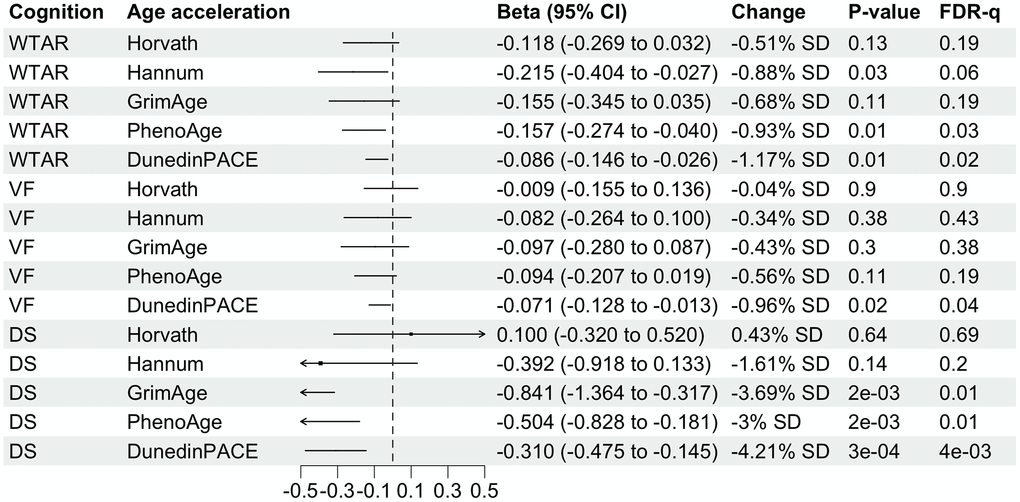
Figure 3.Forest plot showing associations of midlife DNA methylation age acceleration with midlife cognitive function. Betas divided by 100 were shown for associations with DunedinPACE for better visualization. Column “Change” is showing that 1-standard deviation (SD) change in DNA methylation age acceleration is associated with X.XX-unit change in midlife cognitive function. SD for each DNA methylation age can be found in Table 1.
Figure 3 — Associations of childhood, adolescence, and midlife cognitive function with DNA methylation age acceleration in midlife | Aging