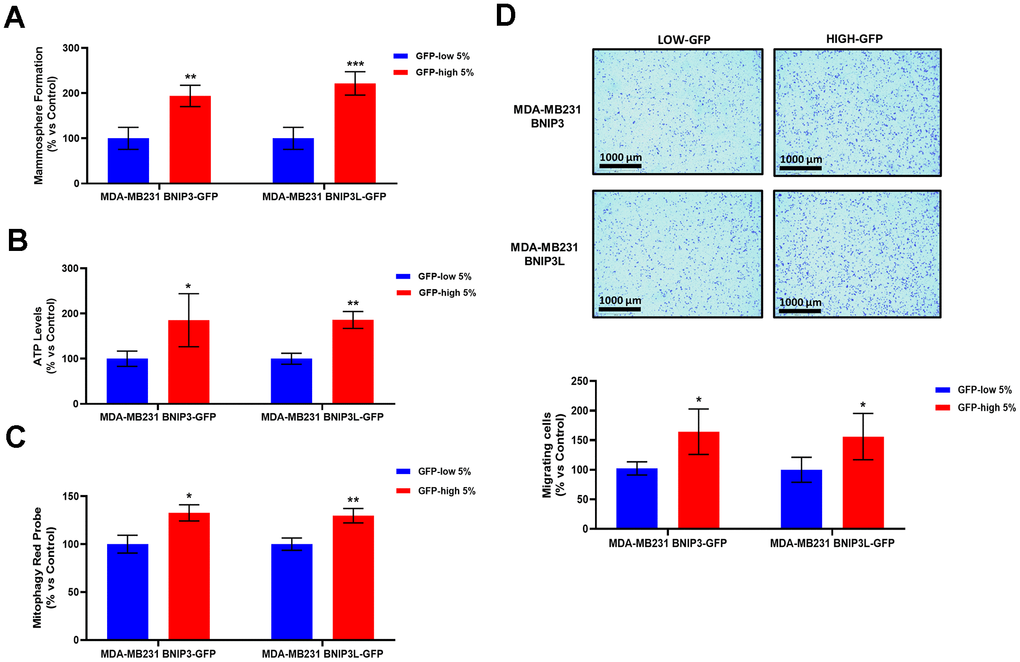
Figure 8.BNIP3(L)-high MDA-MB-231 cells form mammospheres more efficiently, produce more ATP, and show increased levels of basal mitophagy, as well as enhanced cell migration. MDA-MB-231 cells stably-transduced with the BNIP3(L)-GFP constructs were subjected to FACS sorting, to isolate the 5% highest GFP (GFP-high) and the 5% lowest GFP (GFP-low) sub-populations. (A) The GFP-high and GFP-low subpopulations were seeded in low-attachment plates for mammosphere assays and analysed after 5 days. Data are shown as the mean ± standard deviation (SD) (n = 4). Statistical significance was determined using an unpaired Student’s t-test, ** p ≤ 0.01, ***p ≤ 0.001. (B) The GFP-high and GFP-low subpopulations were plated in complete DMEM medium and incubated with the Cell-Titer-Glo 2.0 Reagent for 15 min to determinate the ATP levels. Data are shown as the mean ± standard deviation (SD) (n = 4). Statistical significance was determined using an unpaired Student’s t-test, * p ≤ 0.05, **p ≤ 0.01. (C) Mitophagy levels were assessed with the Mitophagy Red Probe, by flow cytometry. Data are shown as mean ± standard deviation (SD) (n = 3). Statistical significance was determined using an unpaired Student’s t-test, *p ≤ 0.05, **p ≤ 0.01. (D) The migratory capacity of the two sub-populations was assessed using Transwells (24 well-inserts, with an uncoated PET membrane). The cells were allowed to migrate across an uncoated membrane (with 8μm pores) for 16 hours. In the upper panel, the images show the migration for a representative experiment. In the lower panel, the bars show the quantification of the migration. Data are shown as the mean ± standard deviation (SD) (n = 4). Statistical significance was determined using an unpaired Student’s t-test, * p ≤ 0.05.