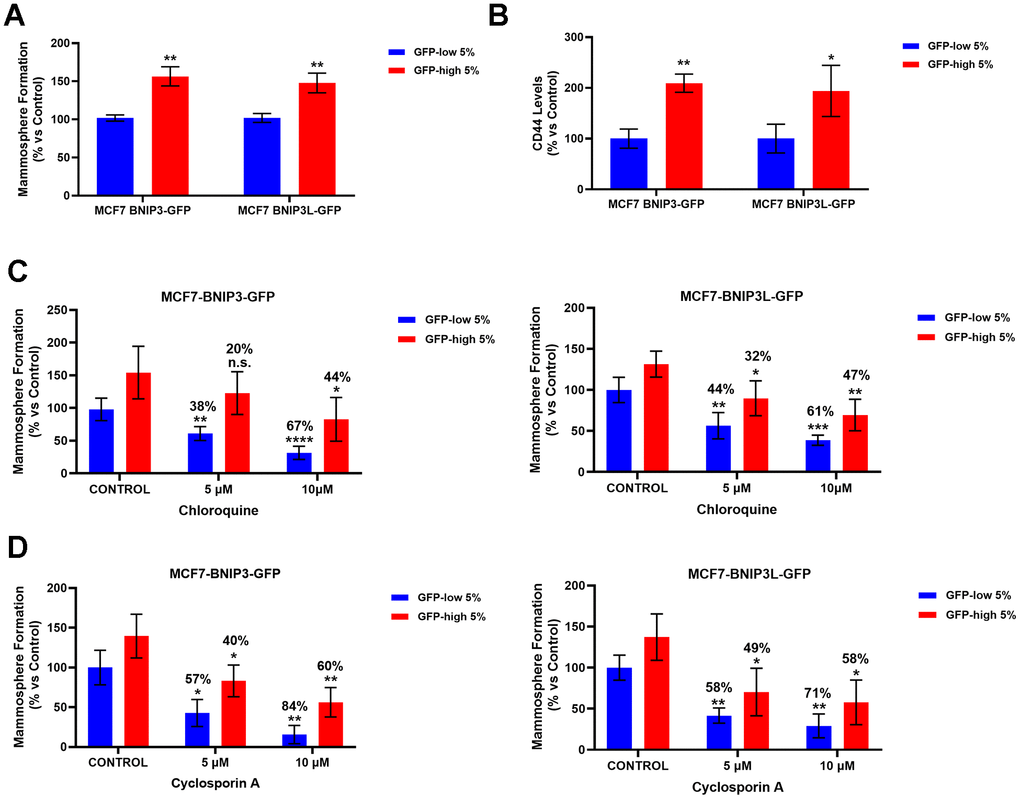
Figure 3.BNIP3(L)-high MCF7 cells form mammospheres more efficiently and show higher levels of the stemness marker CD44, as well as resistance to treatment with Chloroquine and Cyclosporin A, due to their higher mitophagy levels. MCF7 cells stably-transduced with the BNIP3(L)-GFP constructs were subjected to FACS sorting, to isolate the 5% highest GFP (GFP-high) and the 5% lowest GFP (GFP-low) sub-populations. (A) The GFP-high and GFP-low subpopulations were seeded into low-attachment plates for mammosphere assays and analysed after 5 days. Data are shown as the mean ± standard deviation (SD) (n = 3). Statistical significance was determined using an unpaired Student’s t-test, ** p ≤ 0.01. (B) CD44 levels were determined with an APC mouse anti-Human CD44 antibody by flow cytometry. Data are shown as the mean ± standard deviation (SD) (n = 3). Statistical significance was determined using an unpaired Student’s t-test, * p ≤ 0.05, ** p ≤ 0.01. (C) Autophagy inhibitor Chloroquine was tested by using the mammosphere assay to determine the differential sensitivity of GFP-high and GFP-low subpopulations to this drug. Both subpopulations were plated in low-attachment plates for mammosphere assays and incubated with Chloroquine at the indicated concentrations. The number of mammospheres were quantitated after 5 days. The percentage indicated at the top of the bars represents the decrease of that bar compared with its own untreated control (GFP-high treated compared to GPF-high untreated, and GFP-low treated compared to GFP-low untreated). Data are shown as the mean ± SD (n = 4). Statistical significance was determined using one-way ANOVA, Dunnett’s multiple comparisons test, *p ≤ 0.05, **p ≤ 0.01, ***p < 0.001, ****p < 0.0001, n.s. not statistically significant. (D) To evaluate the differential sensitivity of GFP-high and GFP-low subpopulations to a specific mitophagy inhibitor Cyclosporin A, we used a mammosphere assay. Both subpopulations were plated in low-attachment plates for mammosphere assays and incubated with Cyclosporin A, at the indicated concentrations. The number of mammospheres were quantitated after 5 days. The percentage indicated at the top of the bars represents the decrease of that bar compared with its own untreated control (GFP-high treated compared to GPF-high untreated, and GFP-low treated compared to GFP-low untreated). Data are shown as mean ± SD (n = 3). Statistical significance was determined using one-way ANOVA, Dunnett’s multiple comparisons test, *p ≤ 0.05, **p ≤ 0.01.