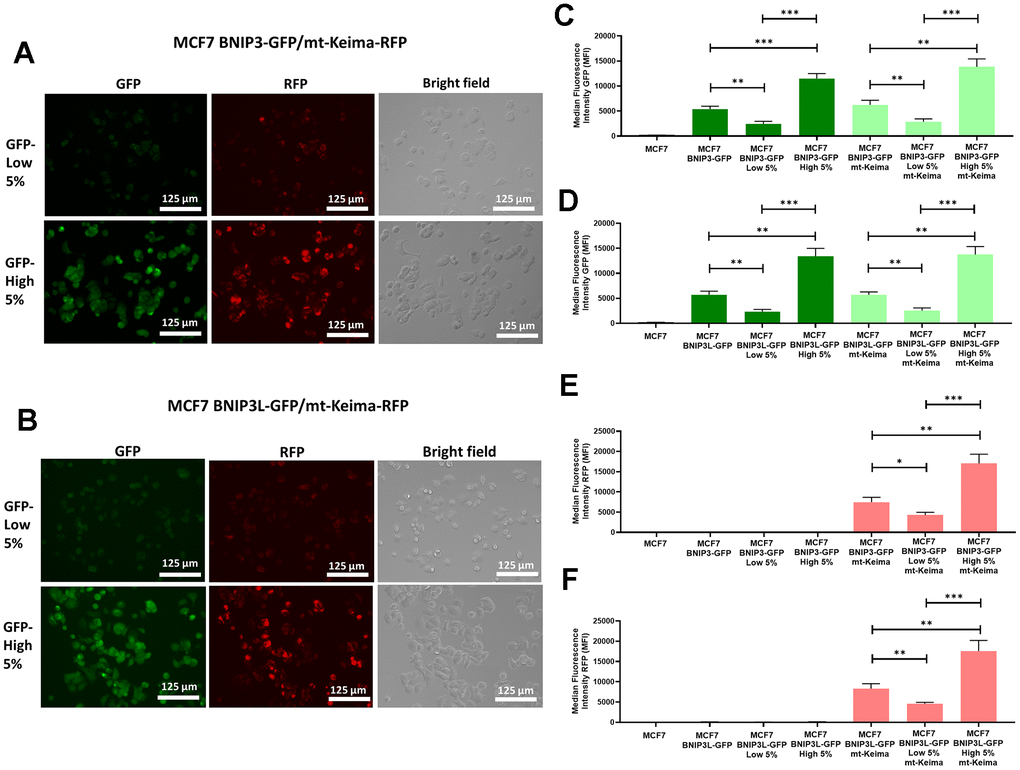
Figure 2.Assessment of basal mitophagy, using a mitochondrially-targeted red fluorescent protein (mt-Keima-RFP), in doubly-transfected MCF7-BNIP3-GFP and MCF7-BNIP3L-GFP cells. MCF7 cells stably-transduced with BNIP3(L)-GFP constructs were subjected to a second round of transfections, with a mt-Keima-HygroR construct to obtain two new cell lines cells, as follows: 1) MCF7 BNIP3-GFP/mt-Keima-RFP and 2) MCF7 BNIP3L-GFP/mt-Keima-RFP. Then, both cell lines were subjected to flow cytometry and sorted according their GFP levels, to isolate the 5% highest GFP (GFP-high) and the 5% lowest GFP (GFP-low) cell sub-populations. (A) Representative microscopic images of MCF7 BNIP3-GFP/mt-Keima-RFP cells, after sorting are shown. (B) Representative microscopic images of MCF7 BNIP3L-GFP/mt-Keima-RFP cells, after sorting are shown. Note that the green fluorescent signal from BNIP3(L)-GFP very tightly co-segregates visually with the red fluorescent signal from mt-Keima-RFP, an established pH-dependent marker of mitophagy. Corresponding quantitative analysis of this co-segregation by FACS is shown in panels (C–F) including various other controls, such as single transfectants and untransfected MCF7 cells. (C) GFP levels in MCF7 BNIP3-GFP cells and MCF7 BNIP3-GFP/mt-Keima-RFP cells after sorting for the 5% highest GFP (GFP-high) and the 5% lowest GFP (GFP-low) sub-populations. (D) GFP levels in MCF7 BNIP3L-GFP cells and MCF7 BNIP3L-GFP/mt-Keima-RFP cells after sorting for the 5% highest GFP (GFP-high) and the 5% lowest GFP (GFP-low) sub-populations. (E) RFP levels in MCF7 BNIP3-GFP cells and MCF7 BNIP3-GFP/mt-Keima-RFP cells after sorting for the 5% highest GFP (GFP-high) and the 5% lowest GFP (GFP-low) sub-populations. (F) RFP levels in MCF7 BNIP3L-GFP cells and MCF7 BNIP3L-GFP/mt-Keima-RFP cells after sorting for the 5% highest GFP (GFP-high) and the 5% lowest GFP (GFP-low) sub-populations. Note that the BNIP3(L)-GFP green signal quantitatively co-segregates with the red signal from mt-Keima-RFP, which is a well-established red fluorescent marker of mitochondria that are being digested within the low-pH/acidic micro-environment of the auto-lysosome/mito-lysosome. Data are shown as the mean ± standard deviation (SD) (n = 3). Statistical significance was determined using an unpaired Student’s t-test, * p ≤ 0.05, ** p ≤ 0.01, *** p ≤ 0.001.