Submit an Article
Navigate
Home
Editorial Board
Editorial Policies
Current Volume
Archive
Scientific Integrity
Publication Ethics Statements
Interviews with Outstanding Authors
Newsroom
Sponsored Conferences
Podcast
Contact
Special Collections
Submit an Article
Online ISSN: 1945-4589
Research Paper
|
Volume 16, Issue 12
|
pp. 10402–10423
Application of angiogenesis-related genes associated with immune infiltration in the molecular typing and diagnosis of acute myocardial infarction
Back to article
Figure 7
(7 of 10)
−
100%
+
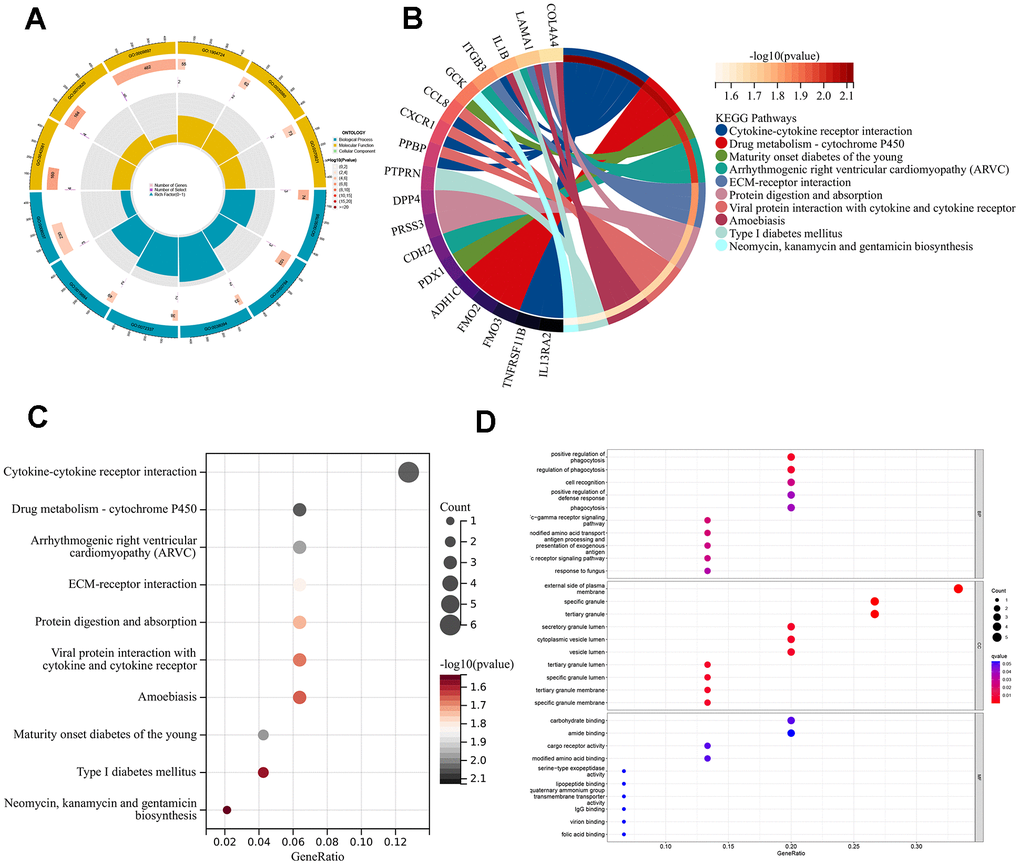
Figure 7.
Enrichment analyses of DEGs in different ARG pantens.
(
A
) GO enrichment analysis circle diagram. (
B
) Chordal graph of KEGG pathways and 18 genes. (
C
) A bubble chart for KEGG analysis. (
D
) A bubble chart for GO analysis.