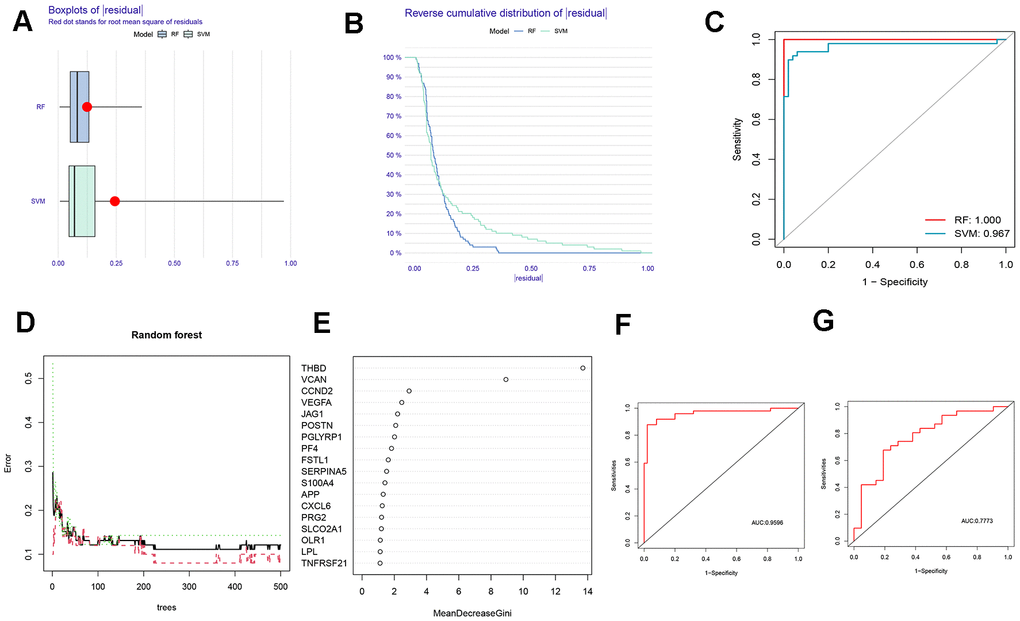
Figure 2.Comparison and selection of random forest (RF) and support vector machines (SVM). (A) Residual Boxplot of RF and SVM. (B) Reverse cumulative distribution of residual. (C) Receiver operating characteristic (ROC) curve of RF and SVM. The AUC of RF and SVM were 1.000 and 0,967, respectively. (D) RF prediction error curves based on a 10-fold cross-validation curve. Treat groups (red line), control groups (green line), and overall samples (black line). (E) The scoring plot of each gene. The higher the score, the more important. (F) The ROC curve of the logistic regression model constructed in AMI based on hub HRGs identified by RF algorithm in the training cohort. (G) The ROC curve of the logistic regression model constructed in AMI in the testing cohort.