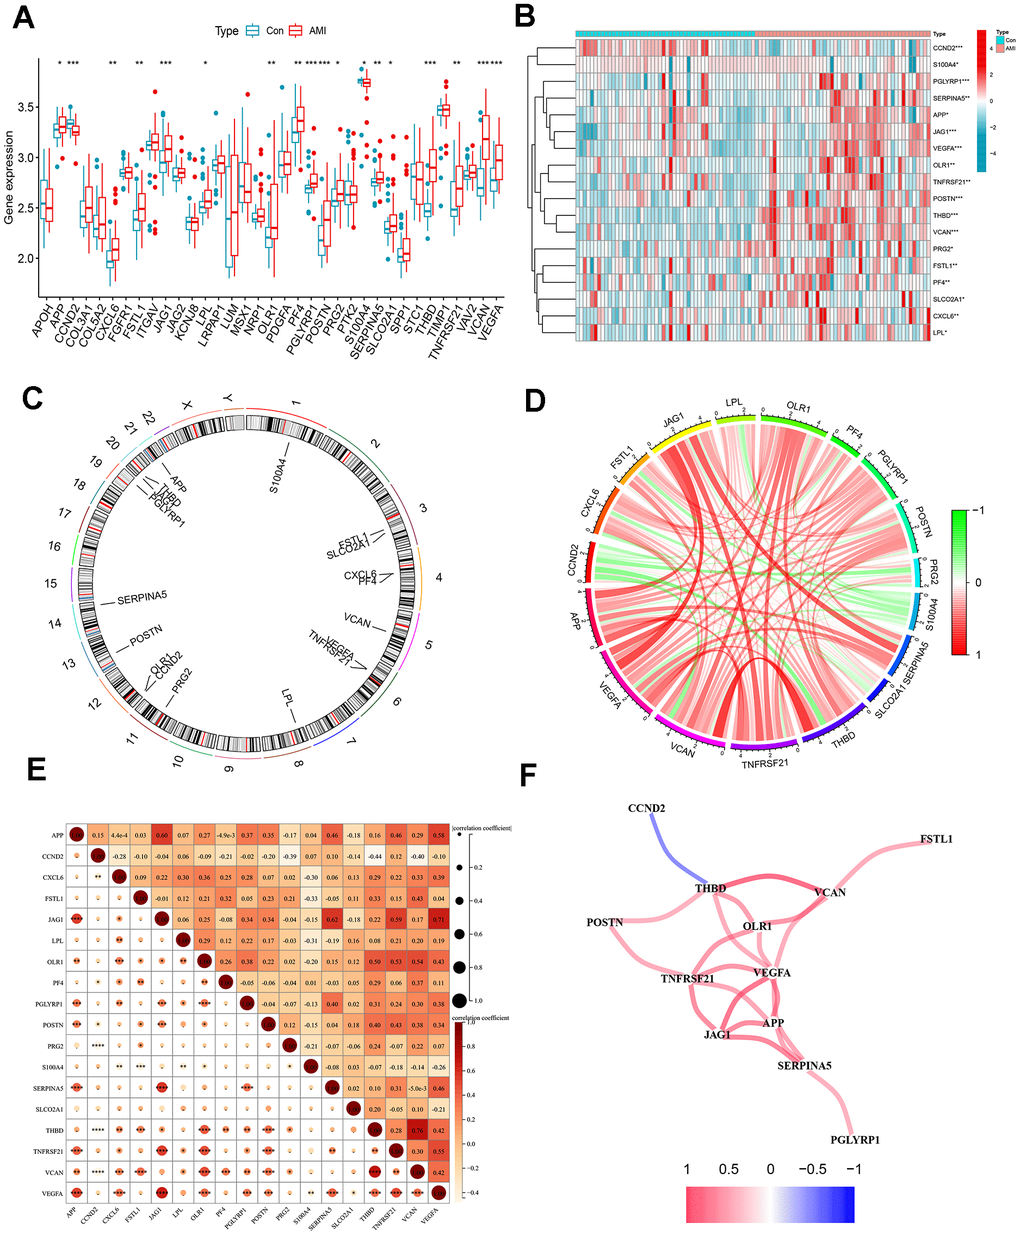
Figure 1.Differentially expressed ARGs in AMI and correlation analysis. (A) Boxplots for differentially expressed ARGs between healthy and AMI groups. (B) Heat map of differential expression of the 18 ARGs. (C) Circos plot of 18 ARGs: showed the distribution of each gene on the chromosomes. (D) Chordal graph of 18 ARGs correlations. (E) Correlation heat map. (F) Interaction network analysis diagram: connecting lines represented interaction relationships. *P < 0.05; **P < 0.01; ***P < 0.001.