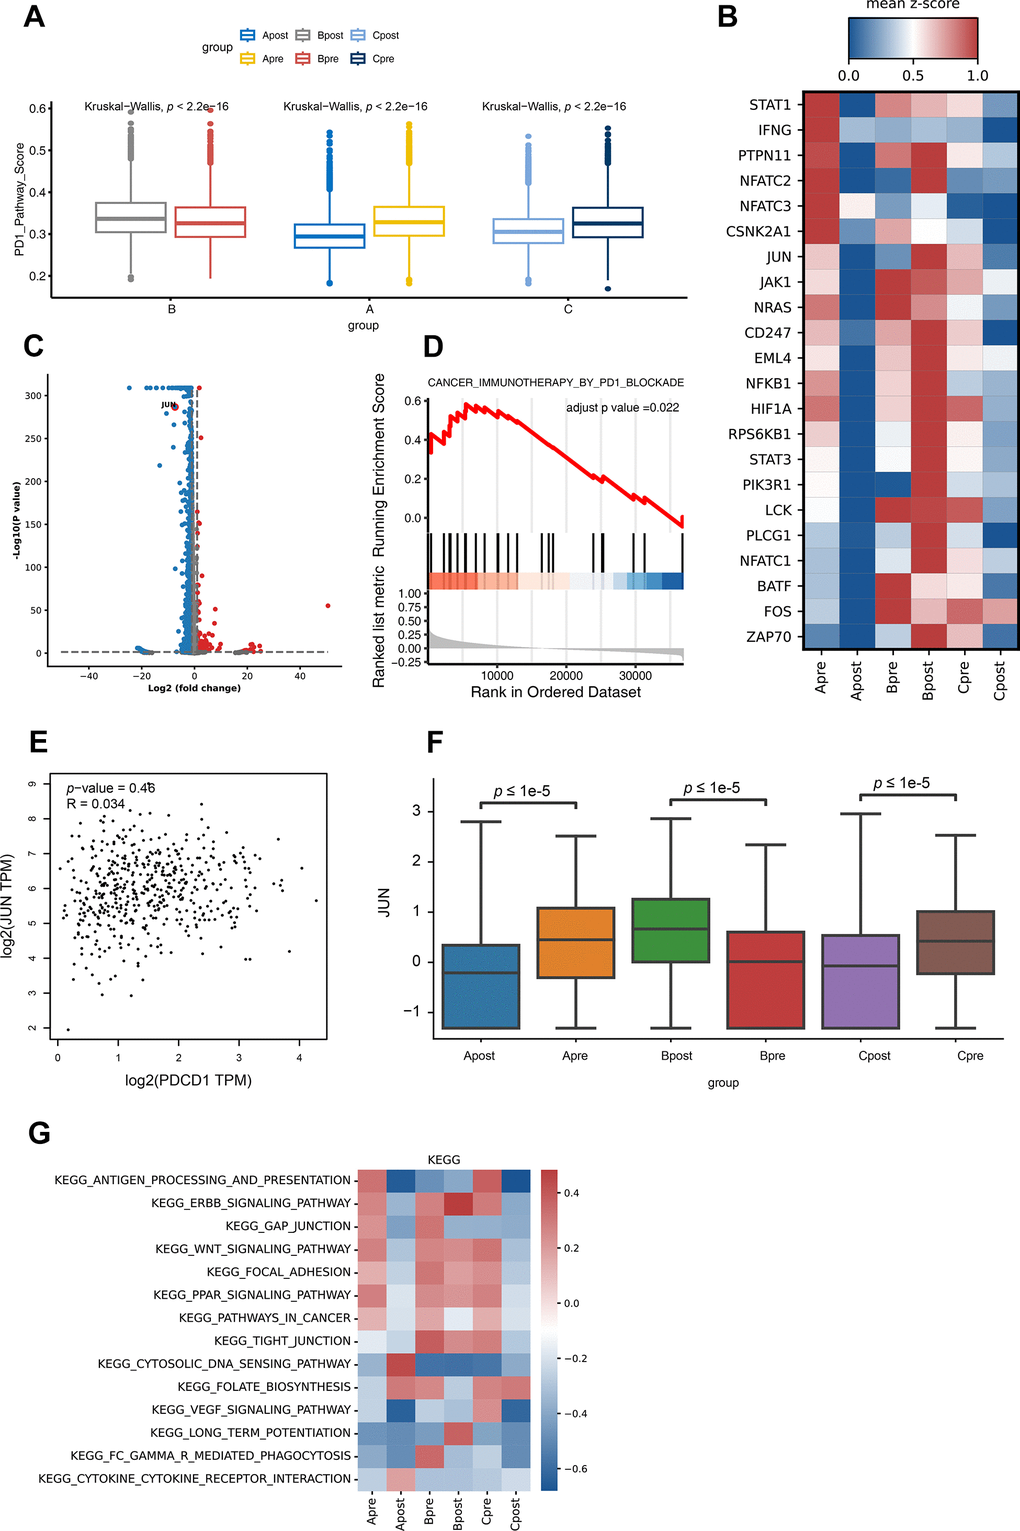
Figure 4.Differential gene expression of PD-1 pathway and KEGG pathway enrichment analysis for CD8 T lymphocytes in each group. (A) The PD-1 pathway score of group A, B and C in PD-1 blockade therapy pre-treatment (Apre, Bpre, Cpre) and post-treatment (Apost, Bpost, Cpost) using Box and whisker plots (value: cell proportion, t test, *:P≤0.05; **:P≤0.01; ***:P≤0.001; ****:P≤0.0001). (B) The hot plot showing differential genes in all groups before (pre) and during (post) the PD-1 blockade therapy (value: mean z-score; red: high expression; blue: low expression). (C) The JUN gene in CD8 T lymphocytes is shown by volcano plot before (pre) and during (post) the PD-1 blockade therapy (P-value < 0.05; |Log2FC| ≥ 1). (D) GSEA analysis of JUN in lung cancer expression data from TCGA. Result showed JUN positively involved in immunotherapy in PD1 blockade (adjust p-value <0.05). (E) The correlation expression between JUN and PDCD1 from LUAD RNA data in TCGA database. (F) The box plot showing the JUN expression level of CD8 T lymphocytes in group A, B and C before (pre) and during (post) the PD-1 blockade therapy. (G) GSVA analysis of 14 pathways for CD8 T lymphocytes in before (pre) and during (post) the PD-1 blockade therapy groups.