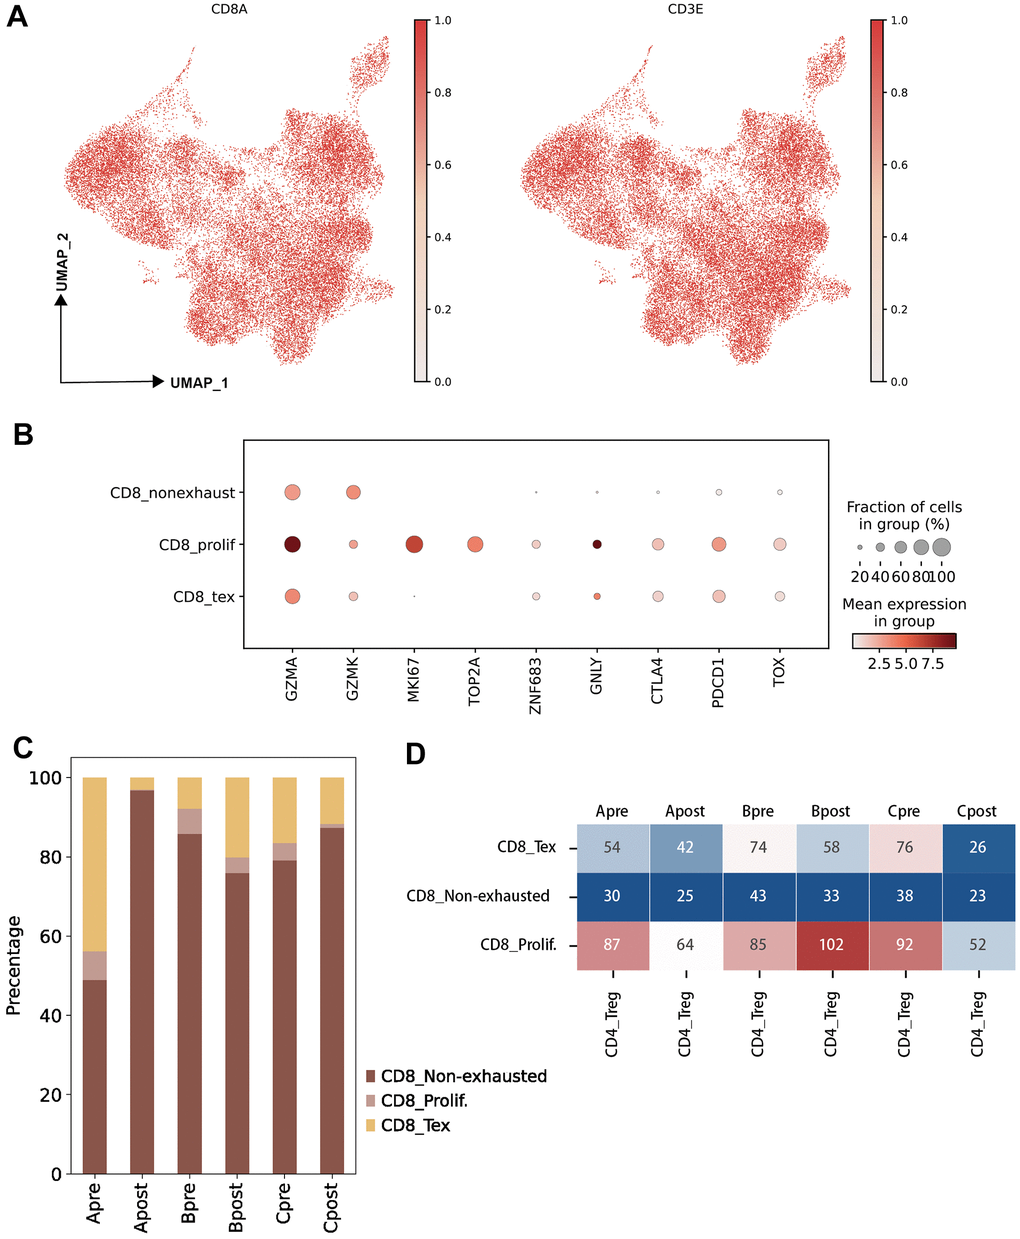
Figure 3.Characteristic of CD8 T lymphocyte subclusters and identified unique cell clusters resistant to PD-1 blockade therapy. (A) UMAP plots showing the CD8 T cell subcluster and majority cell types. The dot plots are colored based on CD8A and CD3E gene (left: UMAP clustering CD8 T subset, right: Lymphocytes defined by CD3E; horizontal axis: UMAP_1, vertical axis: UMAP_2). (B) The statistics of gene markers and cell counts in each subcluster of CD8 T cells using bubble plot (filtered by > 500 cells; CD8 T non-exhausted: non-exhausted CD8 T cells, CD8 prolif: proliferation CD8 T cells, CD8 Tex: exhausted CD8 T cells). (C) The percentage of CD8 T cell subclusters in each group (A: LN metastasis and good response of PD-1 blockade; B: LN metastasis and poor response of PD-1 blockade; C: Primary tumor and good response of PD-1 blockade). (D) Hot map showing the cellular interactions between CD4 Treg cells and CD8 T cell subclusters in each group (value: Ligand-Receptor cunts).