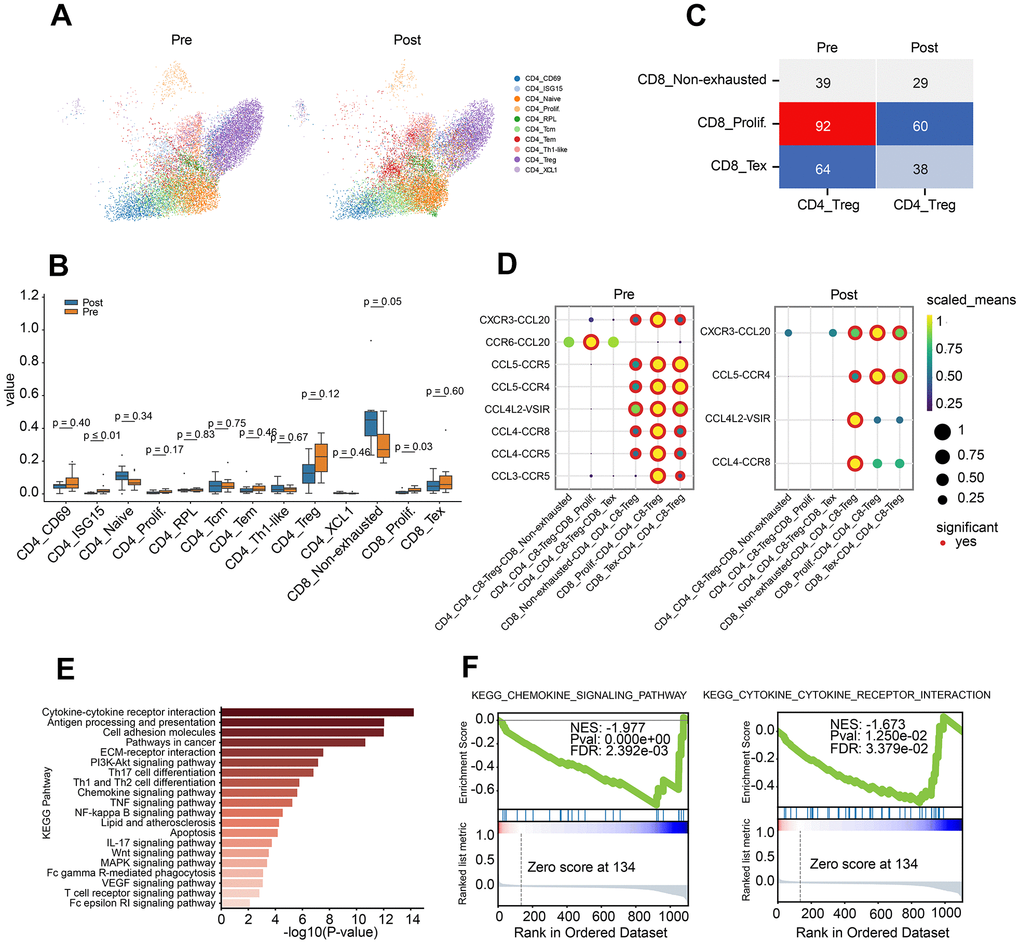
Figure 2.Characteristics of CD4 T lymphocyte subclusters and cellular communication. (A) Two-dimensional UMAP plot of CD4 T lymphocyte subclusters (unsupervised clustering distribution) in pre and post groups; UMAP plots are colored based on the cell subtypes of the CD4 T cells (horizontal axis: UMAP_1, vertical axis: UMAP_2). (B) Proportions of CD4 and CD8 cell subpopulations between pre-treatment and post-treatment using Box plots (value: cell proportion, t test). (C) The cellular communication of regulatory T cells (Treg) and CD8 T subclusters in pre and post groups. (D) The ligand–receptor pairs of chemokine receptor and receptor between Treg cells and CD8 subclusters (CD8 T non-exhausted, CD8 Tex and CD8 prolif.) using Dot plots (value: Scaled Means, CD8 T non-exhausted: non-exhausted CD8 T cells, CD8 prolif: proliferation CD8 T cells, CD8 Tex: exhausted CD8 T cells). (E) KEGG pathway enrichment analysis of differential gene expression of Treg cells in pre-group and post-group. (F) GSEA curve for chemokine signal pathway (left) and cytokine and cytokine receptor interaction (right) of Treg cells in pre-group and post-group.